
Technical Outlook:
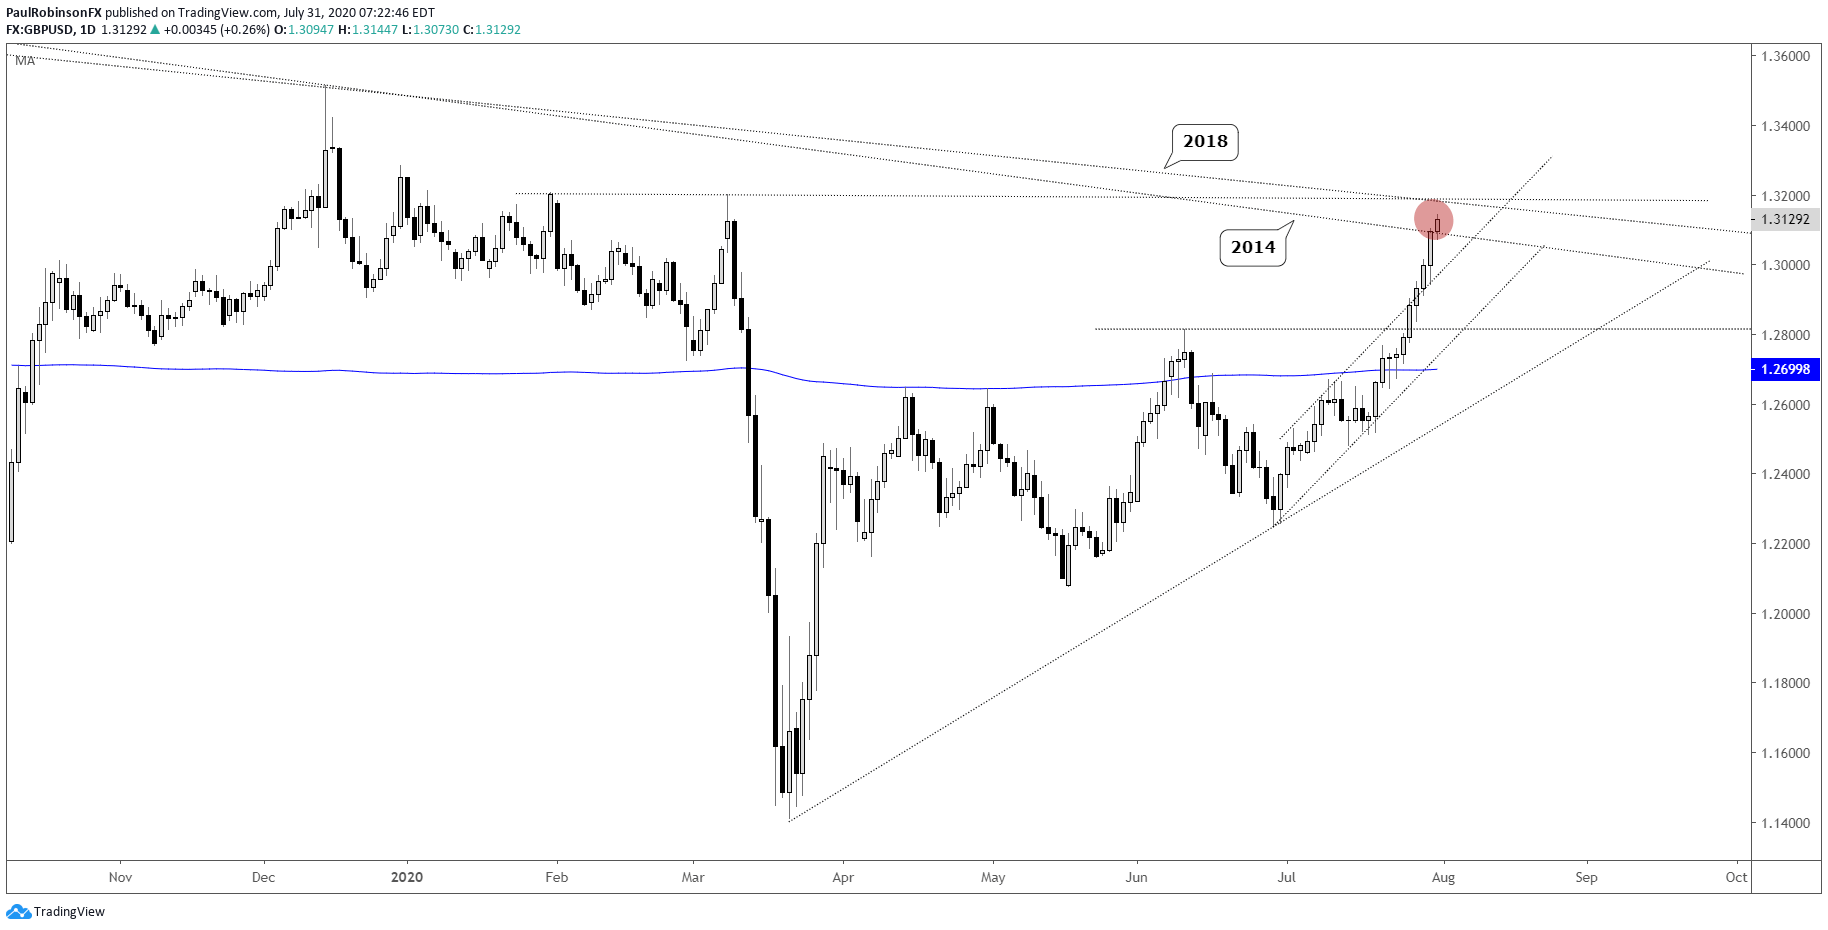
GBP/USD is on a ten day, possible eleven day winning streak if today holds as another up-day. A streak in of itself is not reason to look for a reversal, but it does show how extended Cable has become. Furthermore, with confluent resistance at hand it may be on the verge of at least taking a break. Depending on how that unfolds, it will determine whether the confluence of the 2014/2018 trend-lines and earlier-year price resistance will act as a longer-term ceiling, or only a reason for price to pause before the trend resumes higher. For now, risk/reward doesn’t appear favorable for new longs, while would-be shorts may be best served waiting for momentum to turn down before becoming aggressively involved.
GBP/USD Daily Chart (steadily heading higher)
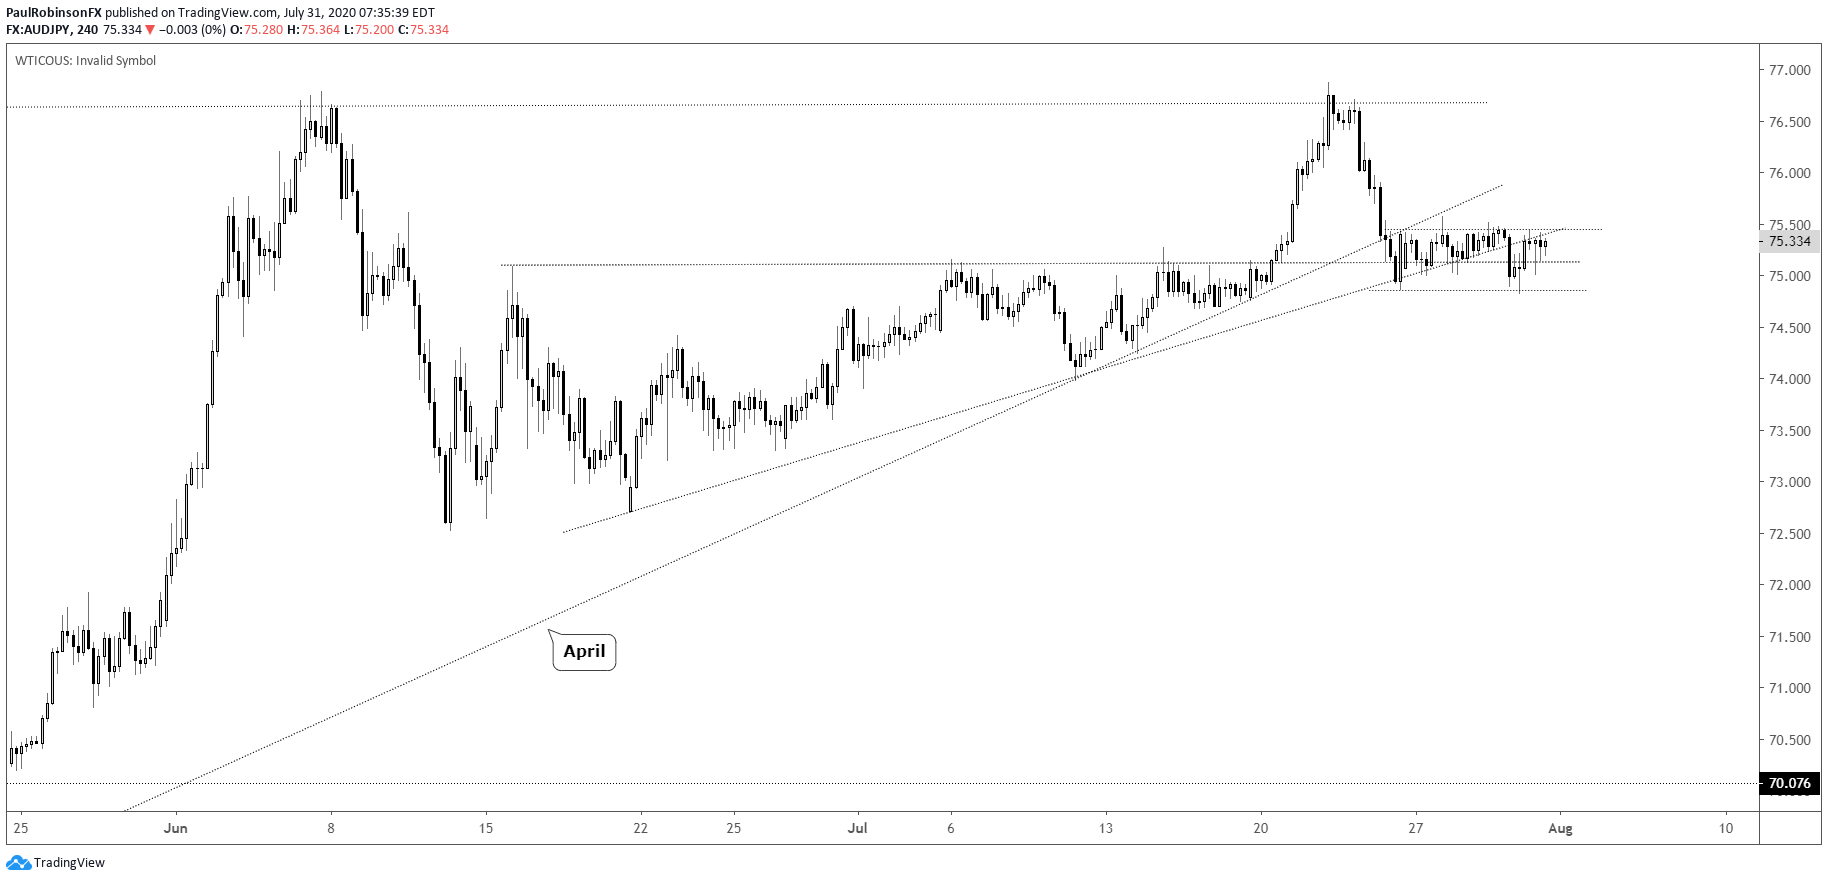
AUD/JPY has an interesting set-up on the 4-hr time-frame. It is below a pair of trend-lines/slopes extending higher from April and more recently June. This comes after a rejection last week at the June high. The decline off the monthly high hasn’t been met with any real effort to push it higher despite support, creating a horizontal pattern that suggests the rejection could pick up more steam to the downside. Watch for a close below 74.82 for confirmation of another leg lower.
AUD/JPY 4-hr Chart (watch 74.82)
AUD/JPY Price Chart by TradingView
For all the charts we looked at, check out the video above…
Resources for Forex Traders
Whether you are a new or an experienced trader, DailyFX has several resources available to help you; indicator for tracking trader sentiment, quarterly trading forecasts, analytical and educational webinars held daily, and trading guides to help you improve trading performance.
---Written by Paul Robinson, Market Analyst
You can follow Paul on Twitter at @PaulRobinsonFX