


Gold Price (XAU/USD) Analysis, Price and Chart
- Gold volatile after printing a record high.
- Positive trend remains intact but caution warranted.

Gold Pumps and Slumps as Volatility Picks-Up
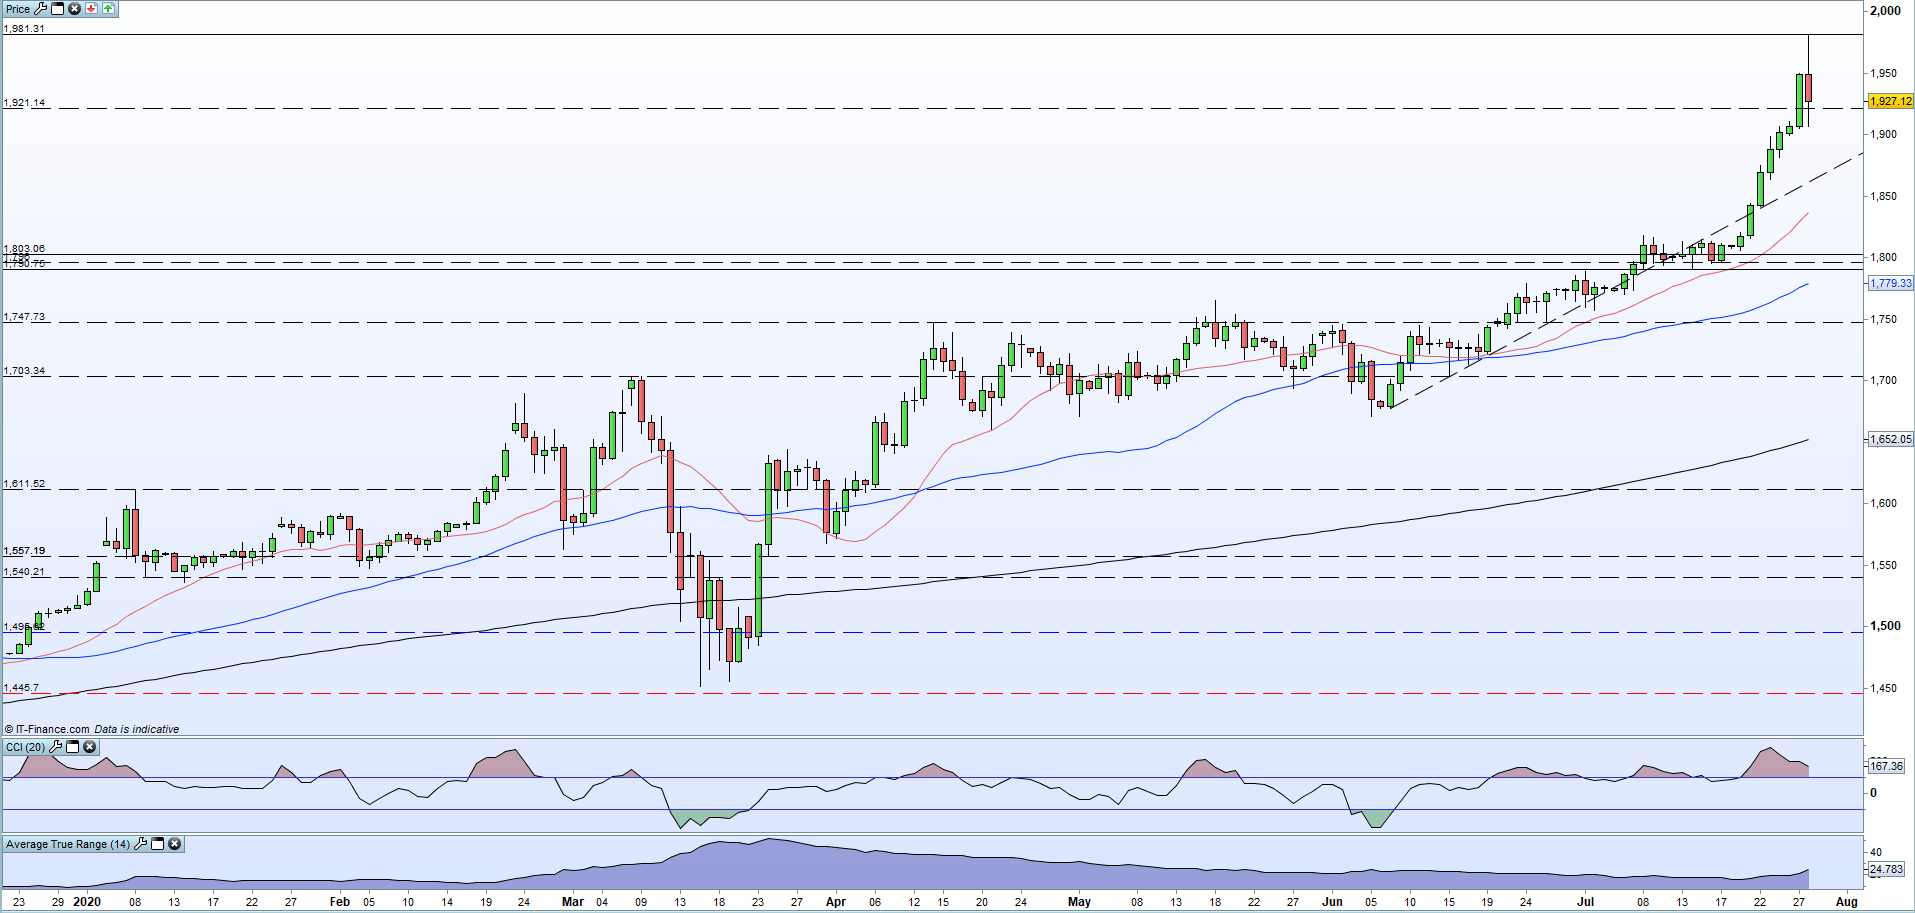
The price of gold hit a new all-time high of $1,981/oz. overnight before sellers grabbed hold of the market and slammed the precious metal back towards $1,900/oz. in a matter of hours. The price is currently consolidating around $1,924/oz. The sell-off mirrored a pick-up in the value of the US dollar (DXY) which bounced back from a near-two year low after a further increase in global COVID-19 cases gave the greenback a small safe-haven bid. Price action becomes more volatile when markets trade at new extremes and gold is no exception with the CCI indicator showing the precious metal deep in overbought territory in the past week.
One technical formation to note today is the ‘bearish engulfing’ candlestick which is close to being made as we write. To complete this formation today, gold will need to close below Monday’s open at $1,904.5/oz.
Trading with the Bearish Engulfing Candle
The dominant uptrend off the early June low remains intact and currently sits around $1,862/oz. Gold trades above all three moving averages by a distance, another supportive backdrop, while the recent set of higher lows and higher highs over the last week remain in place. It remains to be seen if gold slips further or if this is just a market shake-out before the next move higher with the psychological $2,000 level enticingly close. Volatility is picking-up and is at a multi-week high, suggesting further sharp moves ahead before the trend either continues or reverses.
The latest FOMC policy decision will be released on Wednesday at 19:00 BST and this is likely to steer the US dollar, and gold, in the short-term.
Gold Daily Price Chart (January – July 28, 2020)

What is your view on Gold – are you bullish or bearish?? You can let us know via the form at the end of this piece or you can contact the author via Twitter @nickcawley1.


