


DAX 30 & CAC 40 Price Outlooks:
- DAX 30 traders struggle to breach resistance marked by prior highs around 12,930
- The CAC 40 has fallen behind the DAX as it languishes beneath recent peaks and nearby resistance
- How to Trade Dax 30: Trading Strategies and Tips
DAX 30 & CAC 40 Forecasts for the Week Ahead
Price action has been aggressive to start the week in a variety of markets, ranging from gold and silver to EUR/USD. While volatility and break outs have been plentiful, price action across the European indices, particularly the DAX 30 and CAC 40, has been wholly unimpressive. That said, the disappointing performance from the markets in question has helped delineate clear technical boundaries that may impact price once volatility picks up.
DAX 30 Technical Outlook
In the case of the DAX 30, price has shown a reluctance to break above the June high near 12,930. As a result, we can wager this level is an area of possible resistance and the closest to the current trading price. Subsequent resistance may be found along the ascending trendline from March, which currently resides slightly above the projected barrier at 12,930. That said, both levels will have to be surpassed before the DAX 30 can take aim at the July peak at 13,310. A successful move above this level would be an encouraging development for a continuation higher.
DAX 30 Price Chart: 4 – Hour Time Frame (February 2020 – July 2020)
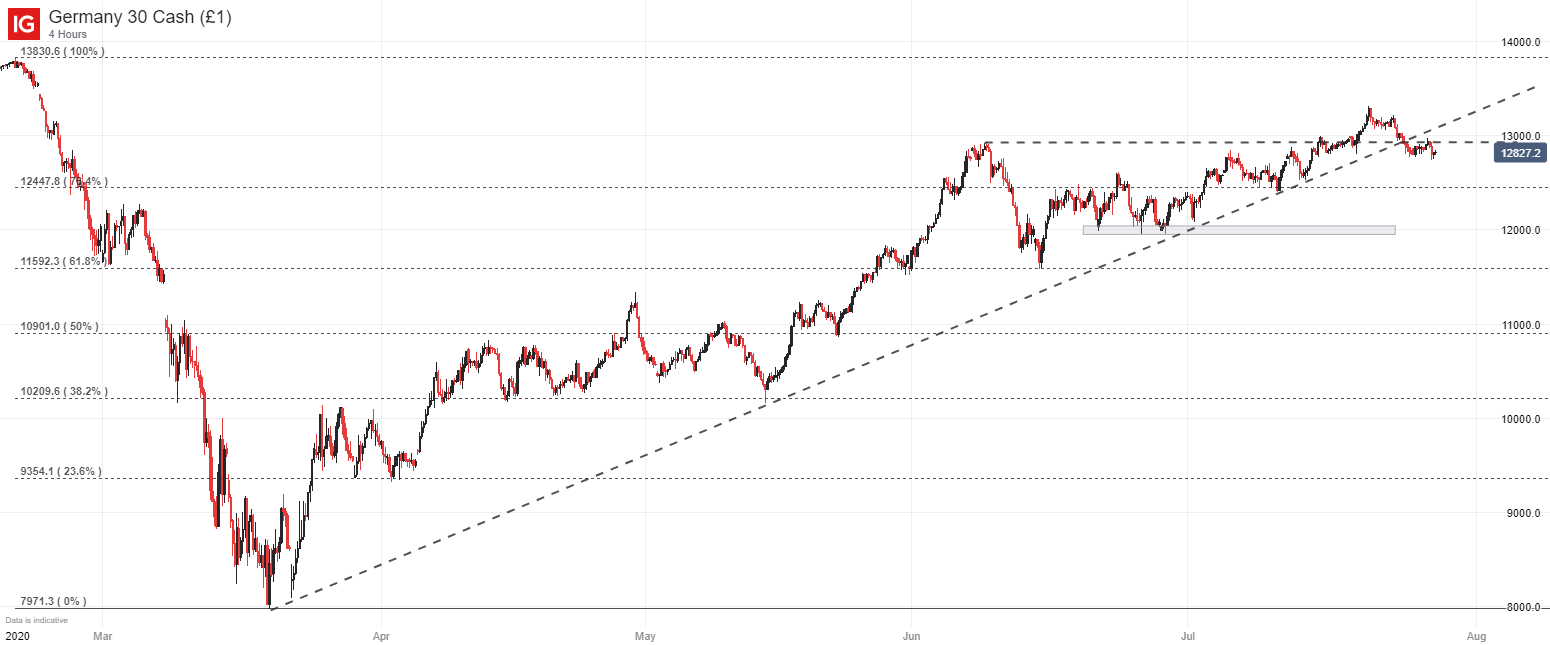
Conversely, nearby support is rather sparse. Apart from the various July swing highs that may provide influence on an intraday basis, the index seems to lack notable support until the Fibonacci level at 12,448.Therefore, the topside appears the more perilous of the two paths but remains a possibility against the broader backdrop that has seen price climb from the March lows.
| Change in | Longs | Shorts | OI |
| Daily | -3% | 7% | 4% |
| Weekly | -10% | 1% | -2% |
Either way, a break above outlined resistance will be required before a larger bullish break can be established. Thankfully for the in pursuit of volatility, the week ahead possesses major event risk in the form of a FOMC meeting and corporate earnings from the Nasdaq’s most influential members. Together, the announcements could seriously shake up the Nasdaq – the current pacesetter across equity markets – and therefore the DAX. In the meantime, follow @PeterHanksFX on Twitter for updates and analysis.
CAC 40 Technical Outlook
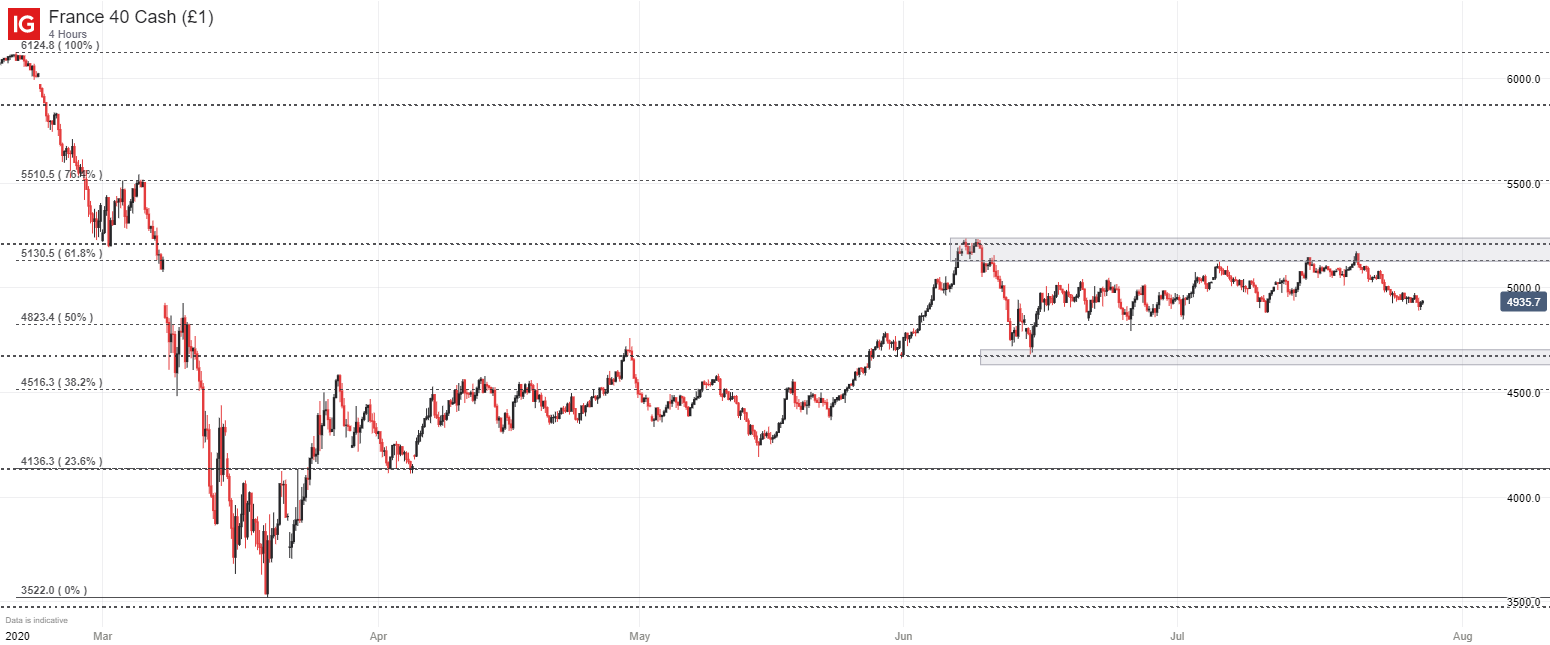
The CAC 40 will also await information from the upcoming events as it trades sideways within a clearly defined range. Given the distance from the current price to the outlined technical barriers, persistent volatility may be required for a serious break out in either direction. With that in mind, the possible resistance from 5,130 to 5,240 and potential support around 4,823 and 4,670, has made the French equity index ripe for range trading opportunities.
The 3 Step Range Trading Strategy
CAC 40 Price Chart: 4 – Hour Time Frame (February 2020 – July 2020)

--Written by Peter Hanks, Strategist for DailyFX.com
Contact and follow Peter on Twitter @PeterHanksFX


