


Silver, XAG/USD, Commodities – Talking Points:
- Silver prices poised to outperform as the fundamental backdrop continues to support the liquidity-driven metal.
- Bullish signals on multiple time-frames suggests this may just be the start of the rise in silver prices after validating the break of a 40-year continuation pattern.
2020 is proving to be a breakout year for liquidity-driven silver prices as the metal breaks above $20/oz for the first time since 2016.
As noted earlier, the unprecedented amount of fiscal and monetary stimulus has provided the perfect liquidity-rich environment for silver and looks set to continue with Senate Majority Leader Mitch McConnell preparing to roll out a new $1 trillion federal support package by the end of the month.

Source – Worldometer
Considering cases of the novel coronavirus continue to climb in the United States, enforcing the reimposition of lockdown measures and restrictions, it is likely this may not be the last injection of fiscal stimulus introduced by US policymakers.
With that in mind, the fundamental backdrop seems to validate the recent resurgence in silver prices and may confirm the bullish technical set-ups seen on multiple time-frames.

Silver Monthly Chart – 40-Year Cup and Handle Pattern Playing Out
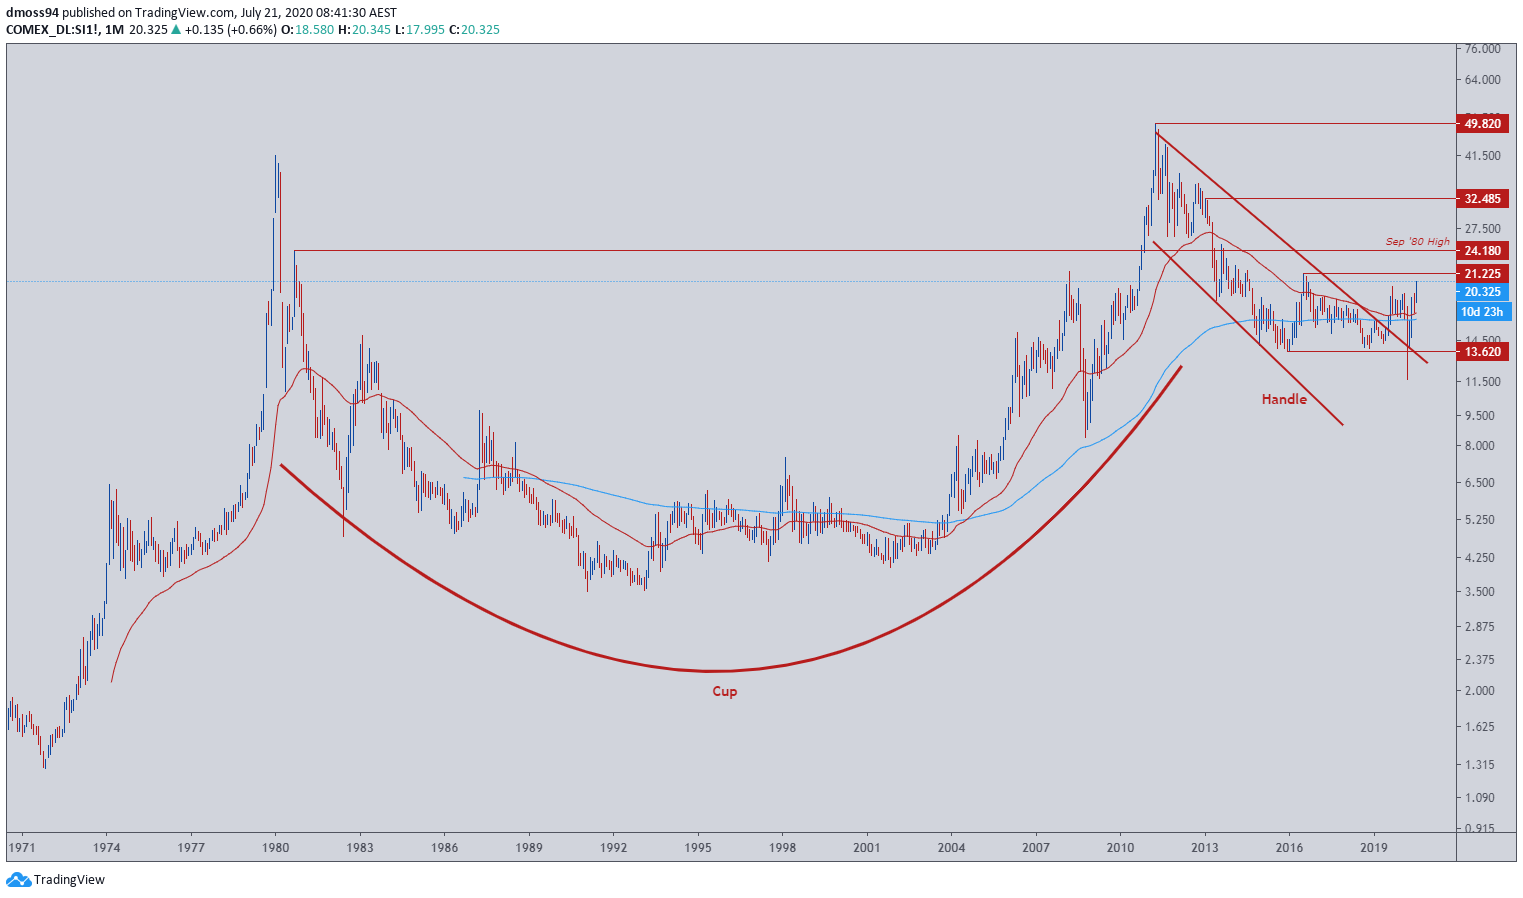
Silver futures monthly chart created using TradingView
Zooming out to a monthly time-frame highlights an immense Cup and Handle bullish continuation pattern that has taken shape over the last 40 years, with the ‘Cup’ extending from the late 1970’s as price sharply collapsed from the 1980 high (41.50).
Taking the better part of 31 years to finally exceed the all-time high set at the start of the 80’s, silver has spent much of the last decade in a gradual decline, carving out the ‘handle’ over an 8-year period.
A break of ‘handle’ resistance in late 2019 propelled price just shy of the $20/oz. However, buyers were unable to overcome psychological resistance resulting in a subsequent throw-back to support at the 2015 low (13.62).
Having said that, the inability of price to close below the 2015 low (13.62) validated the topside break of the bullish continuation pattern, suggesting the resumption of the primary uptrend and potentially bringing the 2011 high (49.82) into play – should price successfully clear a multitude of resistance levels.
Silver Weekly Chart – Bullish Crossover Fueling 6-Week Surge
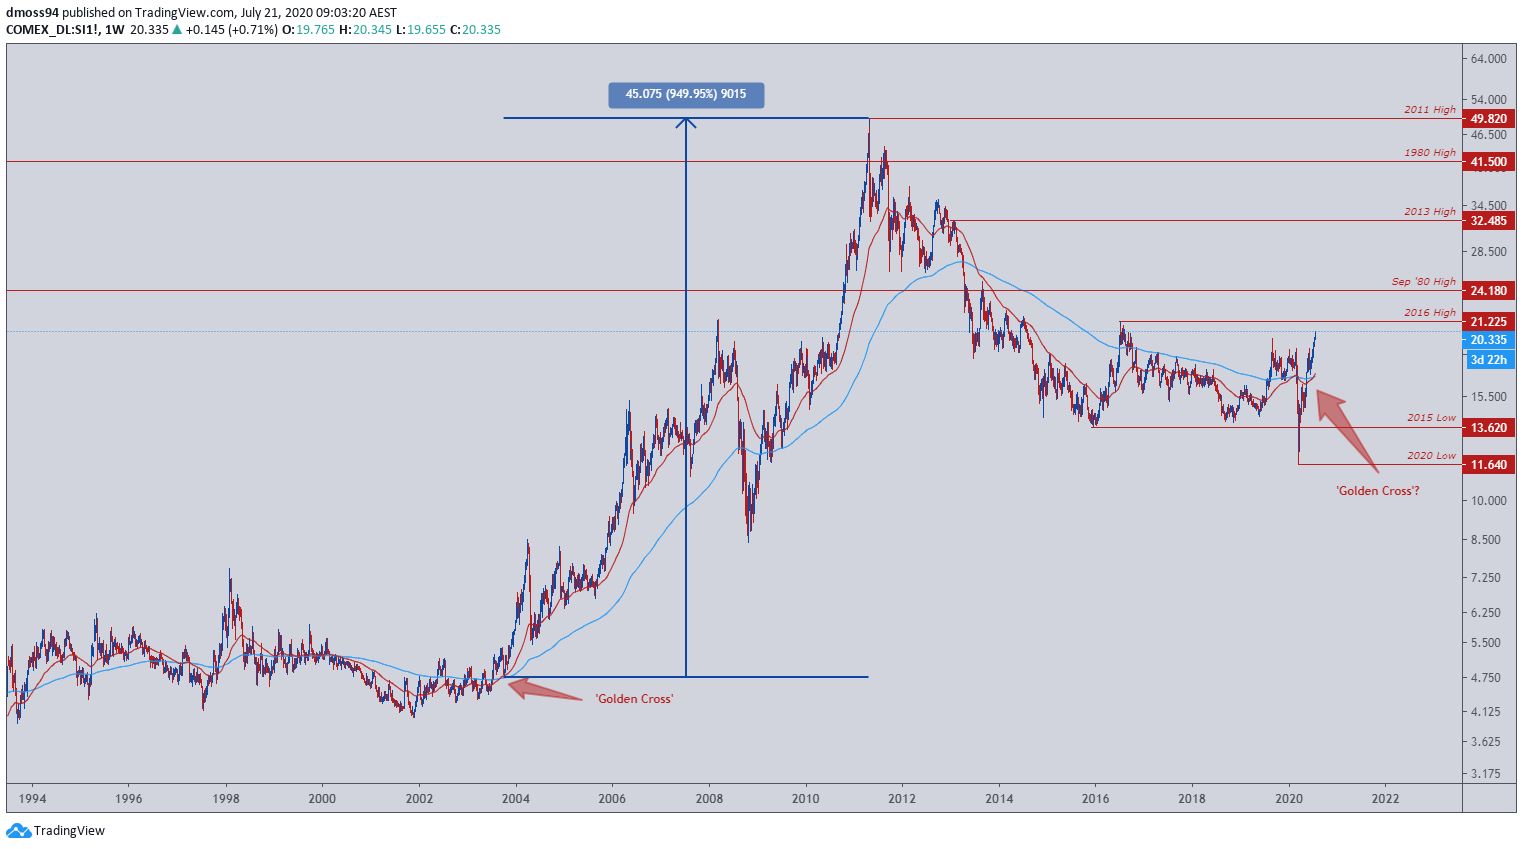
Silver futures weekly chart created using TradingView
Scrolling in to a weekly time-frame reinforces bullish monthly price action as the 50-week moving average (17.04) crosses above the 200-WMA (16.84) in a ‘golden cross’ formation, implying further upside is on the cards.
Although the adage “past performance is not indicative of future results” applies, it is important to note that the last bullish cross-over seen on a weekly time frame generated a 950% surge in silver prices, exploding from the October 2003 low (4.75) to eventually peak at the record high set in 2011 (49.82).
Should this re-eventuate, a push to fresh record highs is not out of the question although it must be added that it certainly will not happen overnight.
Silver Daily Chart – Eyeing 2016 High After Breaking Through $20/oz
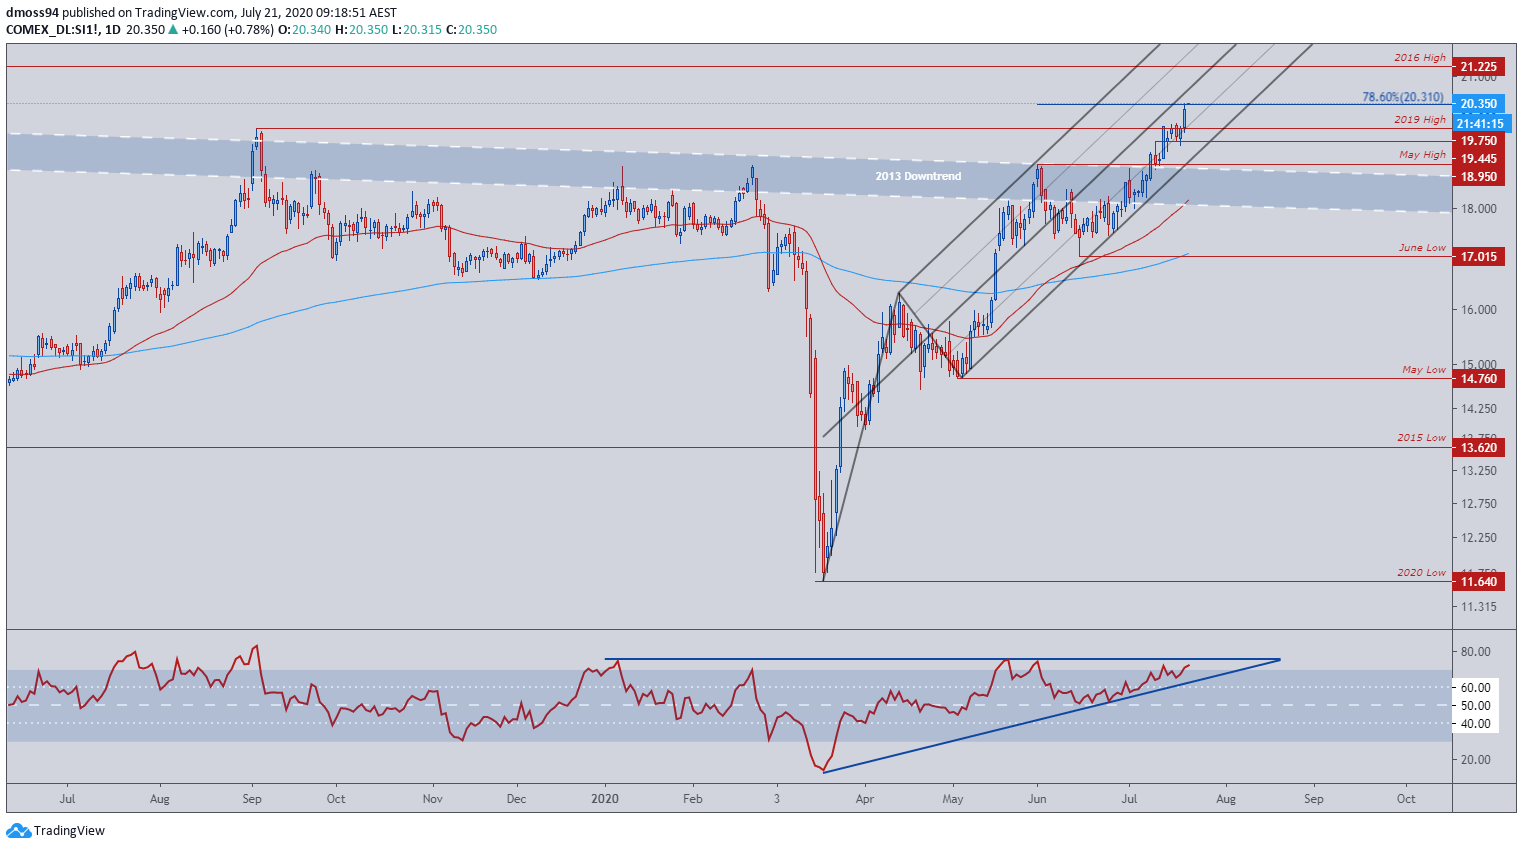
Silver futures daily chart created using TradingView
As it stands, silver looks poised to rise after successfully hurdling resistance at the 2019 high (19.75), as the RSI jumps back into overbought territory for the fifth time this year.
The steepening slope of the 50-day moving average may stoke buying pressure, with temporary support at the 78.6% Fibonacci extension (20.31) potentially providing a platform for price to test the 2016 high (21.23).
However, divergence seen on the RSI - failing to follow price to higher highs - hints at underlying exhaustion in the recent surge from the June low and could result in a period of consolidation above pivotal support at the 2019 high (19.75).
With that in mind, a slight correction back towards the psychologically pivotal $20/oz level may serve as a platform for buyers, as they eye a push above the 2016 high (21.225) to fresh 6-year highs.
| Change in | Longs | Shorts | OI |
| Daily | 1% | -6% | -1% |
| Weekly | 4% | -4% | 2% |
-- Written by Daniel Moss, Analyst for DailyFX
Follow me on Twitter @DanielGMoss


