GBP/USD, EUR/GBP and FTSE 100 – Prices, Charts and Analysis:


The economic calendar is fairly quiet this week with little in the way of important data releases until the latest Eurozone and UK PMI sentiment reports on Friday. In the background, traders are waiting for the release of an important COVID-19 study which some believe will show that an effective vaccine against the virus may have been found. Any confirmation will see UK assets bid. EU-UK trade talks continue this week, with expectations of a meaningful breakthrough low, while the EU COVID-19 recovery is under discussion in Brussels with talk suggesting that the latest iteration of the recovery package may soon pass.
GBP/USD is pressing against 1.2630 and nears a cluster of recent highs and the 200-dma between 1.2668 and 1.2674. A break and open above this zone would see 1.2814 become the next target.
EUR/GBP made a fresh two-week high in early trade but has now faded lower and sits on the recent uptrend line. The next level of support is around 30 pips lower around 0.9035 off the 20-dma and the 38.2% Fibonacci retracement.
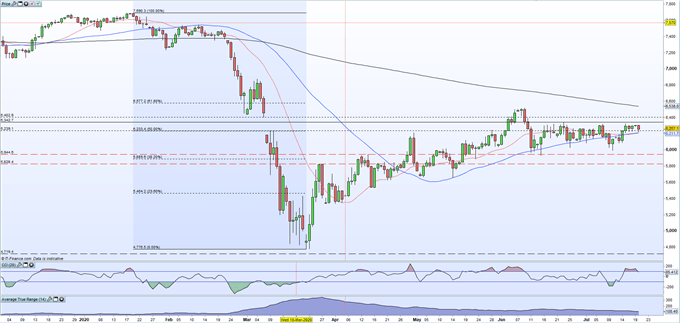
The FTSE 100 continues to trade sideways in a tight range and is finding support from the 20- and 50-dma crossover around 6,211. To the upside, 6,342 needs to be broken and opened above to leave the way open for a re-test of the June 9 multi-month high at 6,522.
FTSE Daily Price Chart (December 2019 – July 20, 2020)

Traders of all levels and abilities will find something to help them make more informed decisions in the new and improved DailyFX Trading Education Centre
What is your view on Sterling and the FTSE – bullish or bearish?? You can let us know via the form at the end of this piece or you can contact the author via Twitter @nickcawley1.


