
UK GDP and GBP/USD – Prices, Charts and Analysis:

The latest UK GDP figures make grim reading with the economy continuing to contract sharply on an annualized basis and just showing marginal growth for May. While the data for May was expected to be weak, due to COVID-19 lockdown measures, the harsh reality is that these figures may well put pressure on the UK government to look at new measures to boost growth. The UK economy did grow in the month of May by 1.8% but fell short of forecasts of 5.5%.
The ONS highlighted that the economy was ‘still a quarter smaller in May that in February’ although in the important services sector, ‘we saw some pickup in retail, which saw record sales online’.

Important UK economic data releases continue this week with the June inflation numbers released on Wednesday and the latest look at the UK employment and average earnings on Thursday. All the data is released at 7:00 UK.
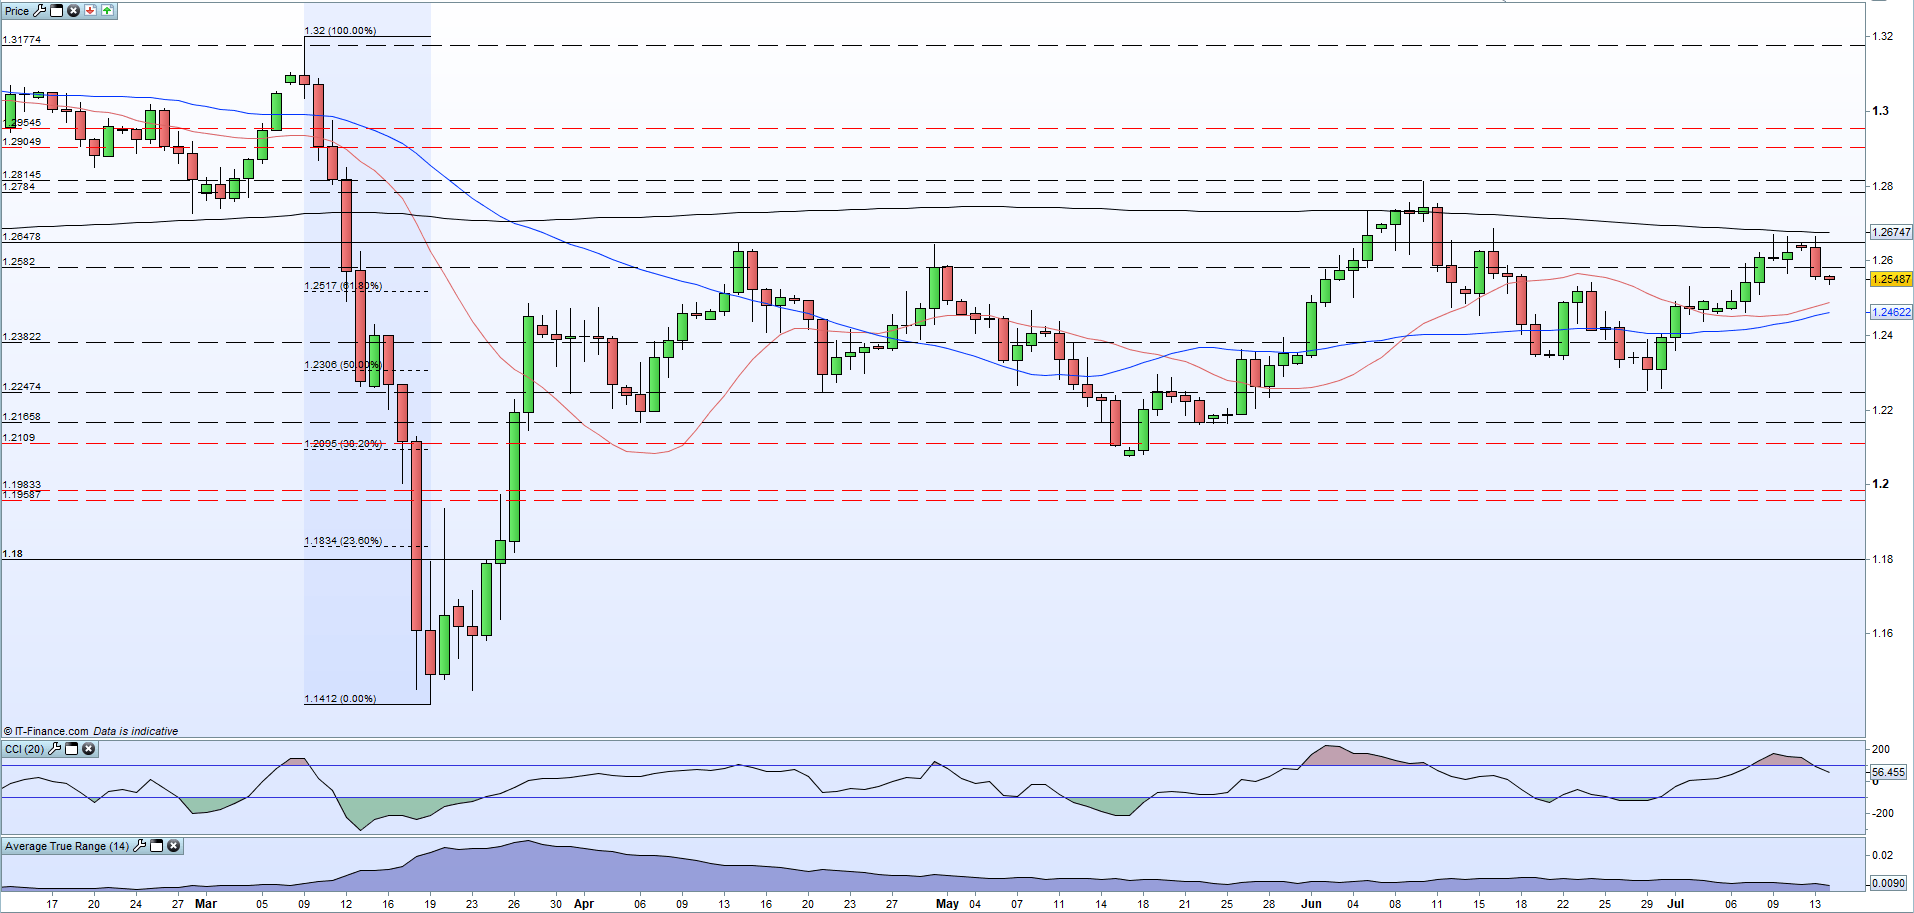
GBP/USD has been moving lower since the start of the week and now trades around 1.2550. Initial support may come off the 61.8% Fib retracement at 1.2517 before a cluster of old lows and the 20- and 50-dmas come into view all the down to 1.2438.
GBP/USD Daily Price Chart (February – July 14, 2020)
| Change in | Longs | Shorts | OI |
| Daily | -3% | 8% | 0% |
| Weekly | 35% | -30% | 4% |
Traders of all levels and abilities will find something to help them make more informed decisions in the new and improved DailyFX Trading Education Centre
What is your view on Sterling – bullish or bearish?? You can let us know via the form at the end of this piece or you can contact the author via Twitter @nickcawley1.