


US Dollar Price, News and Analysis:
- The US dollar sell-off continues, daily chart turns increasingly negative.
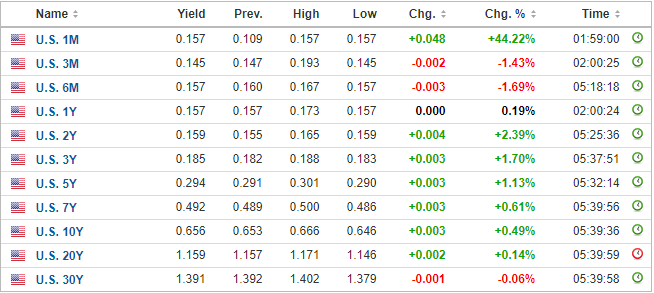
- Short-dated US Treasuries offer wafer-thin returns.

The US dollar sell-off continues and a complete re-trace of the March 9-22 surge may be playing out. The constant printing of US dollars to counteract the effects of COVID-19 continues to weigh on the currency while the one-month to three-year US Treasury yield curve is flat and offers investors little in the way of any return. The yield curve move lower in longer-dated USTs has been helped by Fed officials jawboning about yield curve control – keeping interest rates at or below a specified target – although this recent move lower has eased the pressure on the Fed to set any specific levels for now. A weaker US dollar will please US President Trump and the export sector as they look to exit the economic damage caused by COVID-19.
US Treasury Yields
US continuing jobless claims (27 June) are released at 13:30 UK today along with initial jobless claims and the 4-week claimant count, both for the week ending 4 July. Both jobless claims numbers are forecast to fall marginally and any deviation from expectations may provoke a reaction in the US dollar.
The daily US dollar is showing increasing signs of weakness and is building a repeat pattern of the late-March to late-May sideways move before the greenback broke sharply lower. The US dollar basket now trades below all three moving averages, while the 50-dma fell through the 200-dma at the end of last week forming a bearish death cross. There is little in the way of support until the June 10 multi-month low at 95.63, which if broken convincingly would set up the March 9 low at 94.54 as the next target. The CCI indicator shows that the greenback is oversold, suggesting a period of consolidation made be needed before the next move.
The latest CoT report showed that speculators have cut back their bearish US dollar bets and this may temper the ongoing sell-off. The CoT report should be closely watched over the next couple of weeks to see if this move continues or if renewed bearish bets against the US dollar return.
Euro Sentiment Softens, Are US Dollar Bears Heading for the Exit? – CoT Report
US Dollar (DXY) Daily Price Chart (December 2019 – July 9, 2020)


What is your view on the US Dollar – bullish or bearish?? You can let us know via the form at the end of this piece or you can contact the author via Twitter @nickcawley1.


