


NZD/USD, AUD/NZD, Jacinda Ardern, New Zealand-Sino Relations – Talking Points:
- Prime Minister Jacinda Ardern’s balancing act with China may fuel further gains for the trade-sensitive New Zealand Dollar
- AUD/NZD poised for continued declines should price breach the neckline of a potential Head and Shoulders reversal pattern
- NZD/USD eyes yearly highs after a topside break of Descending Triangle consolidation.
Ardern’s Balancing Act with China may Prove Fruitful
New Zealand’s economic dependence on China has seen Prime Minister Jacinda Ardern break ranks with her fellow members of the “Five Eyes” Alliance – Australia, Canada, the United Kingdom and the United States - refusing to sign the joint statement condemning Beijing’s imposition of the national security law in Hong Kong.
Although the Prime Minister released a separate statement condemning the encroachment, it is becoming increasingly evident that New Zealand wants to ensure the relationship with its biggest trading partner remains fruitful and robust.
Considering the fallout facing her Trans-Tasman counterpart, Scott Morrison, it comes as little surprise that Ardern would look to take a different approach. As the Australian Prime Minister’s calls for an independent enquiry into the origin of Covid-19 were met with the introduction of 80% tariffs on local barley products and a recommendation that Chinese citizens avoid travel to the country.
With China accounting for 23% of New Zealand’s exports and roughly 19% of tourism spending, a break-down in this pivotal relationship would be devastating for the local economy.
However, the ability to address these contentious humanitarian issues without ruffling Beijing’s feathers may see the New Zealand Dollar outperform its major counterparts and continue its climb towards yearly highs.

AUD/NZD Daily Chart – Head and Shoulder Pattern Still in Play
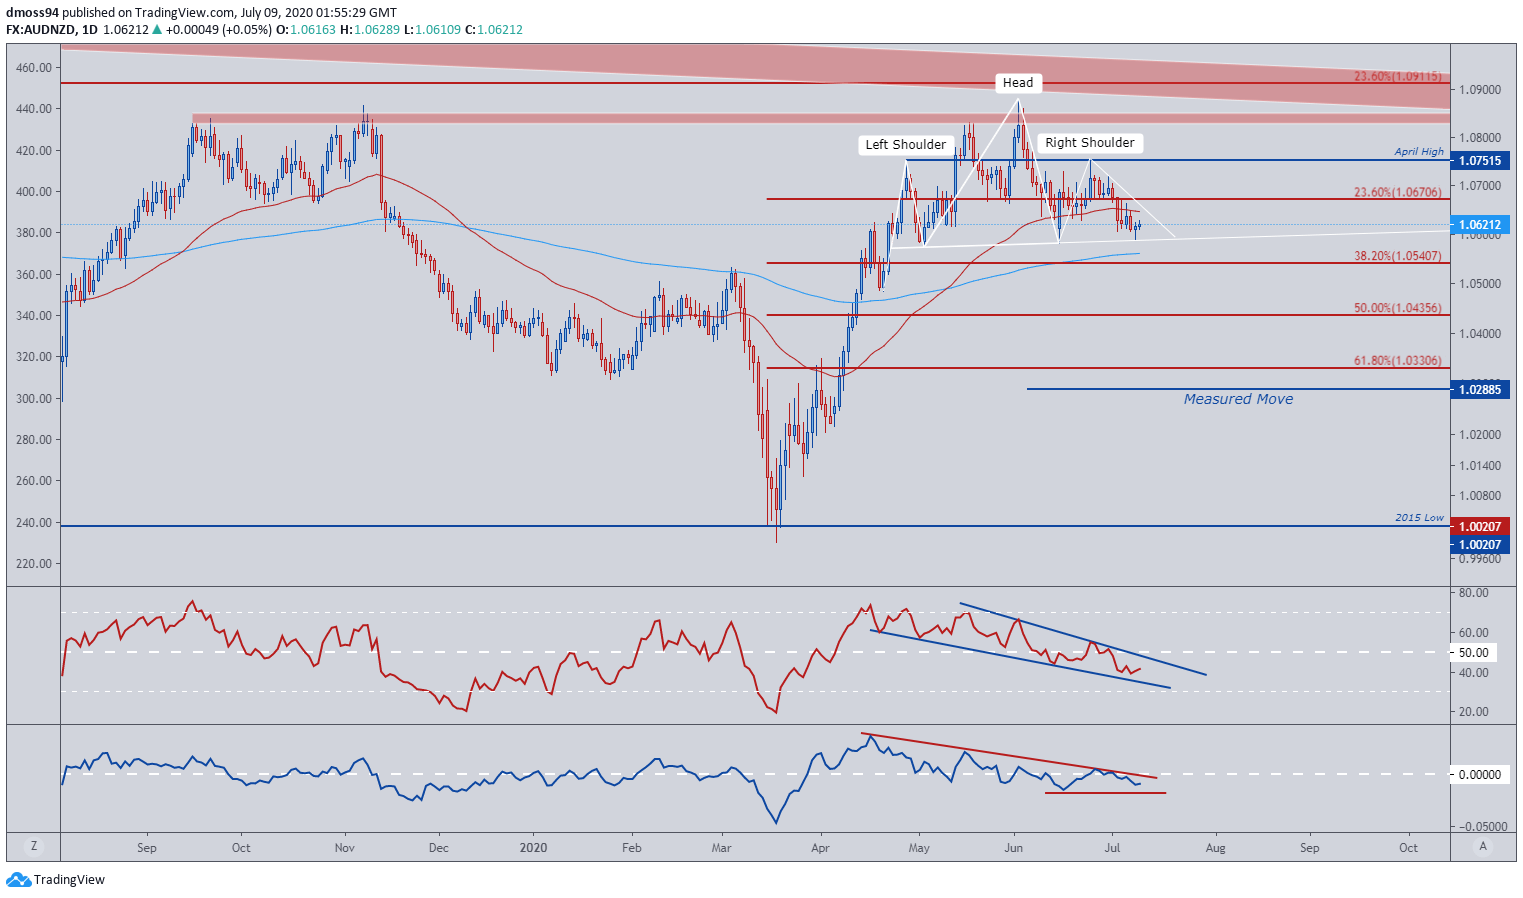
AUD/NZD daily chart created using TradingView
A Head and Shoulders reversal pattern seems to be taking shape just above the 200-day moving average (1.0560), as price sits precariously above the neckline at the 1.06 handle.
A break of the neckline looks more and more likely, as both the RSI and Momentum indicators push lower.
A daily close below the 200-DMA is needed to validate the bearish reversal pattern and may potentially fuel a decline back towards the 61.8% Fibonacci, with an implied move suggesting AUD/NZD may fall as far as the 1.03 handle.
NZD/USD Daily Chart – June High Resistance Stifling Upside Potential

NZD/USD daily chart created using TradingView
The NZD/USD exchange rate’s topside break of Descending Triangle consolidation pushed price back above the 38.2% Fibonacci (0.6550) to test the post-crisis high set in mid-June (0.6585).
Although the Momentum indicator continues to strengthen into positive territory the development of the RSI hints at the potential for a short-term correction back to support at the 78.6% Fibonacci (0.6480), as the oscillator struggles to climb into overbought territory.
A daily close above resistance at the June high (0.6550) may encourage buyers and carve a path for NZD/USD to test the December high (0.6755).
On the flipside, a break and close below the March high (0.6448) could signal a resumption of the long-term downtrend extending from the 2014 highs, potentially leading to a sharp decline back to support at the 200-day moving average (0.6335)
| Change in | Longs | Shorts | OI |
| Daily | -6% | -7% | -6% |
| Weekly | 9% | -2% | 6% |
-- Written by Daniel Moss, Analyst for DailyFX
Follow me on Twitter @DanielGMoss


