


Euro Stoxx 50, FTSE 100 Price Analysis & News
- Euro Stoxx 50: Fails to Maintain Foothold Above 200DMA
- FTSE 100: Momentum Signals Point to Downside
- DAX 30: Edges Towards Key Pivot
Euro Stoxx 50: Fails to Maintain Foothold Above 200DMA
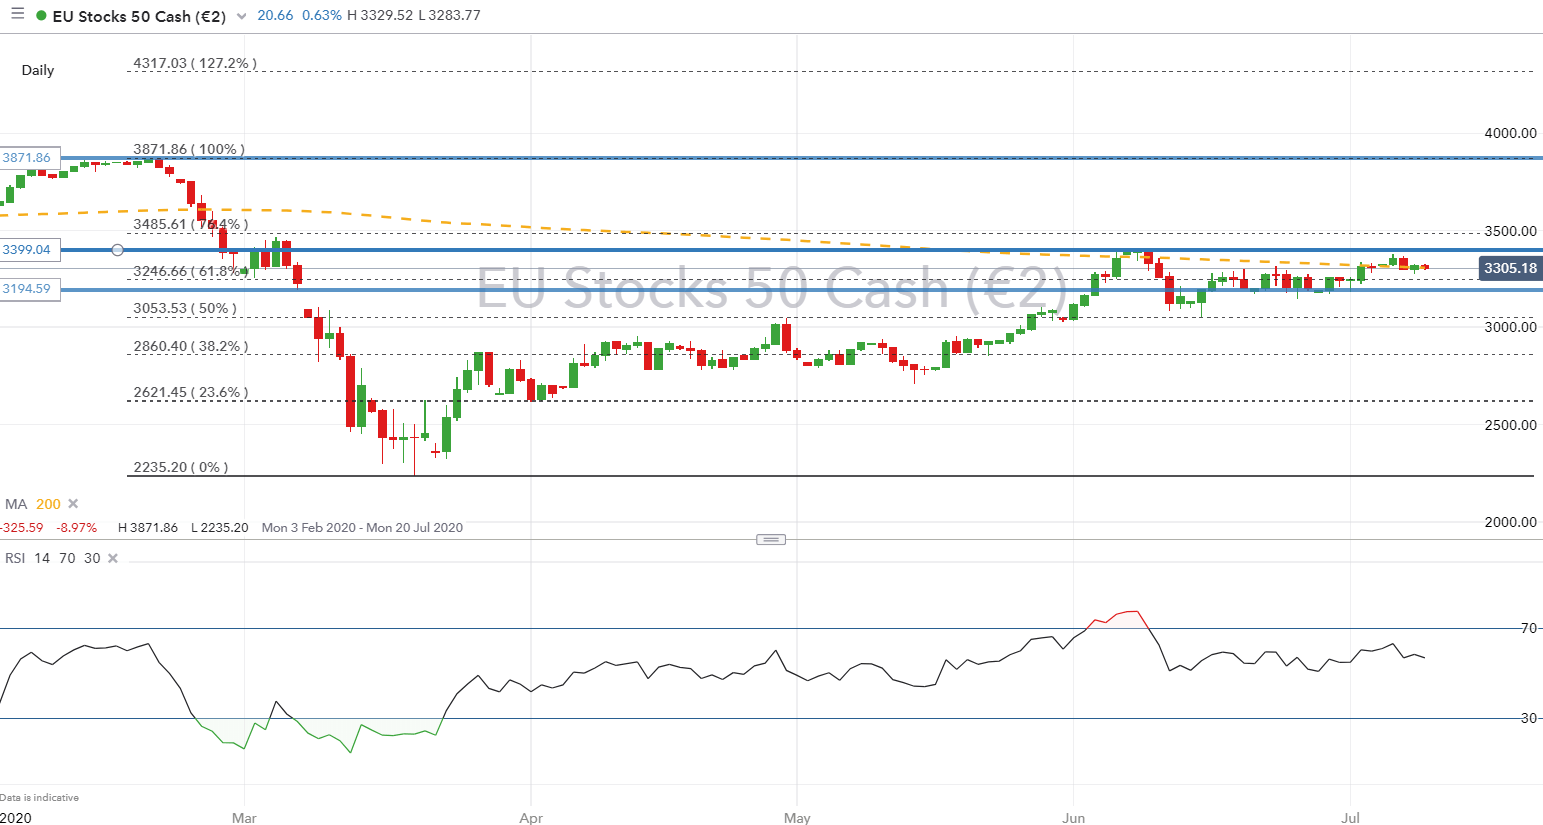
The Euro Stoxx 50 has failed to sustain a break above the 200DMA, signalling signs that upside in the index may be stalling in the short-term. That said, the index has shown little signs of a notable direction, which in turn places two key levels in focus. On the topside, a close above 3399, which denotes the post Q1 sell-off would be needed to reinforce the uptrend. However, while initial support is seen at 3246 (61.8% Fibonnaci retracement), it would take a close below 3195 (early March gap) to potentially reinforce expectations of a pullback.

Euro Stoxx 50 Price Chart: Daily Time Frame
FTSE 100: Momentum Signals Point to Downside
Momentum signals are leaning bearish on the FTSE 100, which is currently testing support at the 100DMA. Failure to keep the index afloat may exacerbate downside in the near-term, exposing the FTSE 100 to the July 1st low at 6080, before the June 25th low at 6024. On the topside, gains remained capped from 6300. Although, with that said, a break above 6330 would be needed to negate a bearish bias.
| Change in | Longs | Shorts | OI |
| Daily | 7% | -2% | 1% |
| Weekly | 25% | -13% | -2% |
FTSE 100 Price Chart: Daily Time Frame

Source: DailyFX
FTSE 100 Price Chart: 4-Hour Time Frame
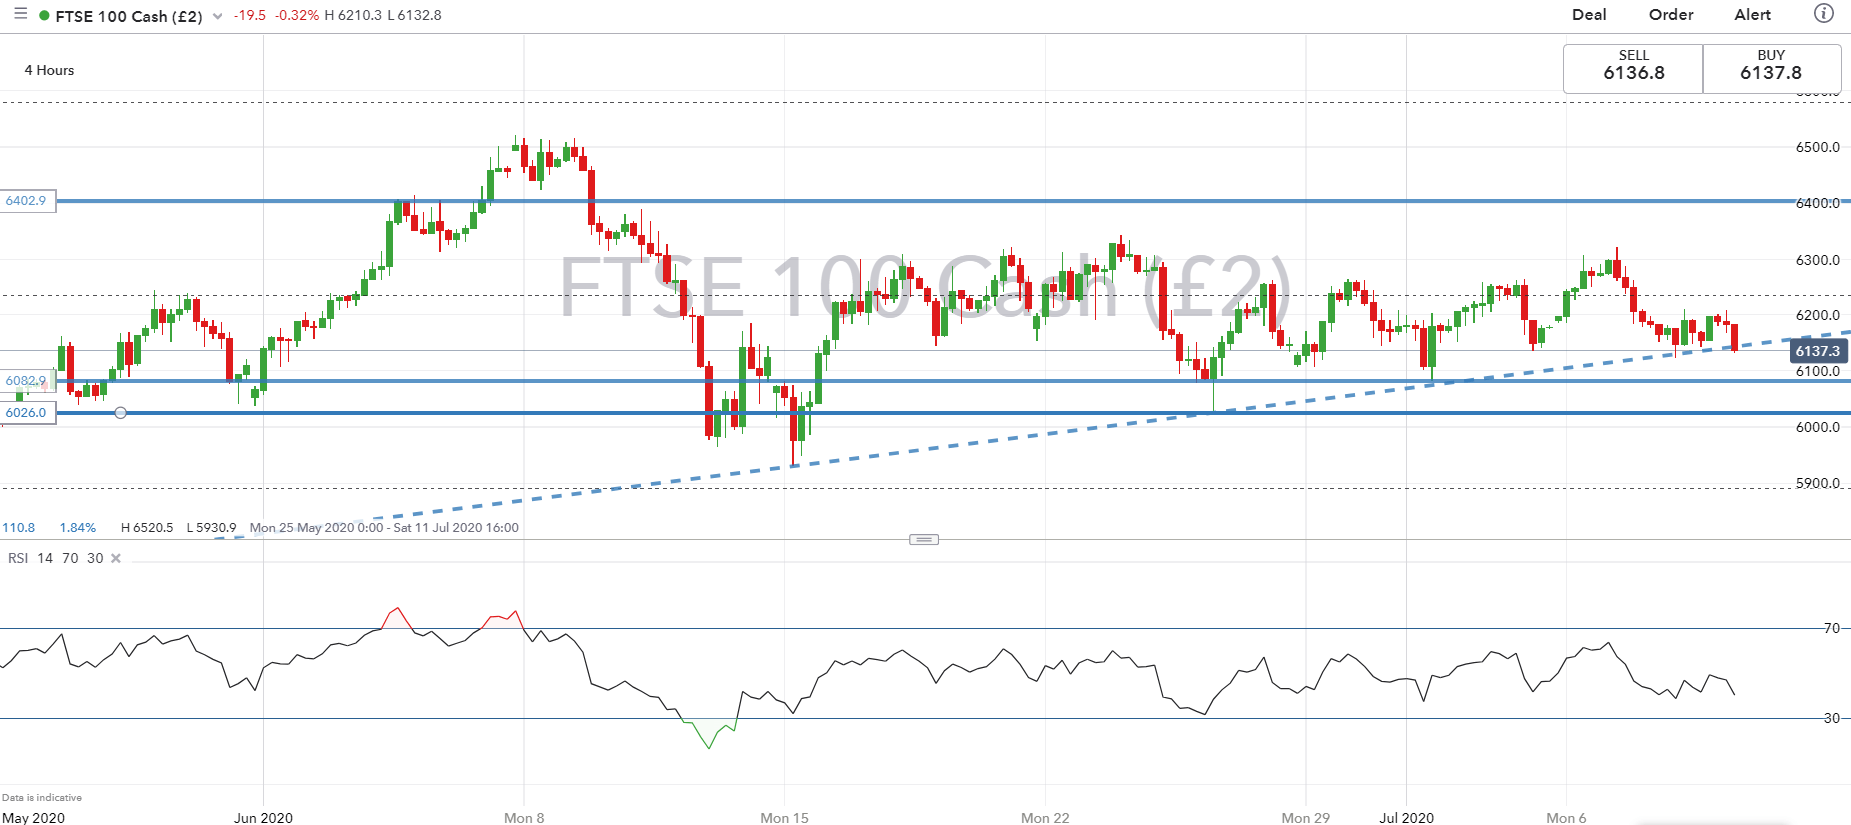
Source: DailyFX
DAX 30 Edges Towards Key Pivot
The DAX remains biased to the upside and thus remains firmly within a broad uptrend. However, gains appear to be limited to 12950-13000 with the index failure to breach this key area on two occasions. As such, this remains the key pivot for the index with a rejection yet again likely to renew focus on 12500, which roughly coincides with the 76.4% Fibonacci retracement. That said, on the fundamental front, key focus will be on the possibility of the EU agreeing the recovery fund proposal and thus investors will be keenly awaiting mid-July EU summit.
DAX 30 Price Chart: Daily Time Frame

--- Written by Justin McQueen, Market Analyst
Follow Justin on Twitter @JMcQueenFX


