


Copper Price (XAUUSD) Analysis, Price and Chart
- Copper’s multi-month rally took a sharp leg higher this week.
- Bullish golden cross appears on the chart.

Copper: A Real V-Shaped Recovery
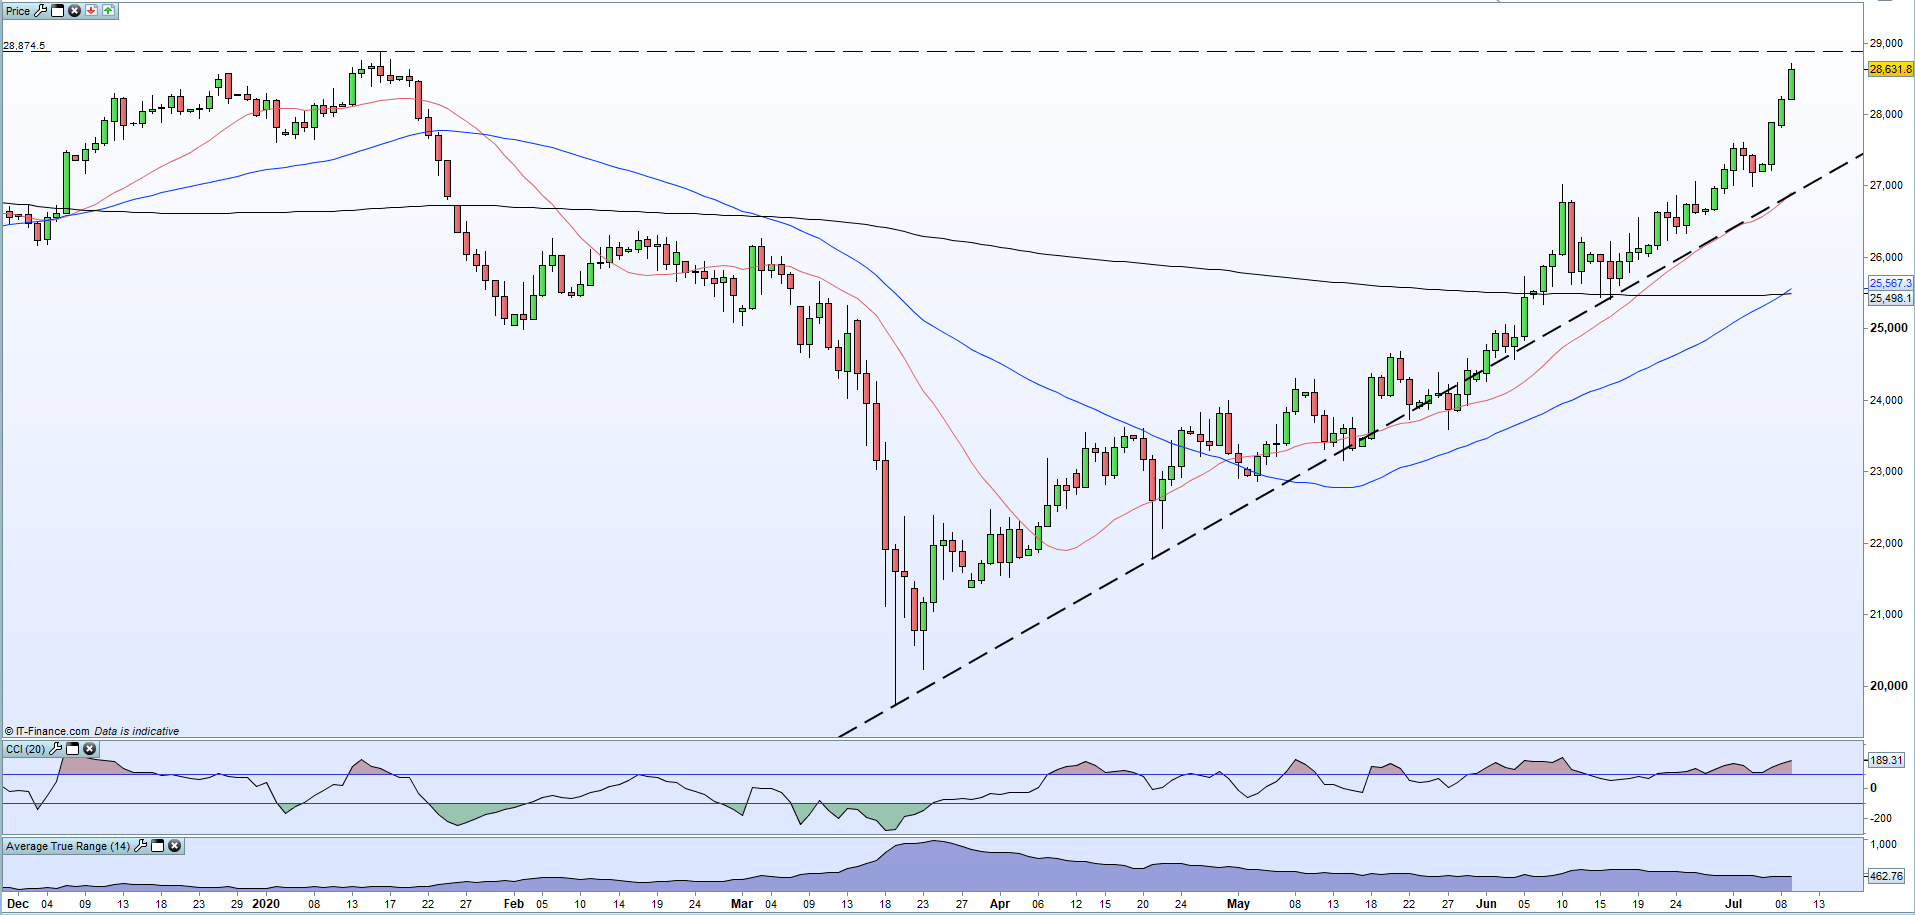
Copper continues to rally and the ongoing move higher accelerated again today with the price now threatening the 2020 high at 2.8874 (high grade copper). The move has been firmly underpinned by a strong supportive uptrend off the March 19 low, despite entering overbought territory on a number of occasions over the last four months. Any sell-off has seen buyers move back into the market and higher lows and higher highs dominate the daily chart.
Copper has also just made a bullish golden-cross – the 50-dma trading up through the 200-dma – a set-up noted in Tuesday’s report. In this report I noted that ‘while the uptrend remains in place, copper should continue to stair-step higher, although a break and open below trend would negate the positive sentiment’.
Copper Price Rally Consolidates Back Into Supportive Trend
The steepness of the trendline does add a note of caution but copper remains a distance above this line and remains positive until the trendline is convincingly broke. Ahead the 2020 high at 2.8874 is the next target before the April 2019 high at 2.9971 comes into play. As mentioned earlier copper is in overbought territory, again, and this may slow down the rally especially after this week’s sharp moves.
Copper Daily Price Chart (December 2019 – July 9, 2020)

What is your view on Copper – are you bullish or bearish?? You can let us know via the form at the end of this piece or you can contact the author via Twitter @nickcawley1.


