Canadian Dollar (USD/CAD Price, News and Analysis:
- The Canadian dollar continues to appreciate against the greenback.
- Thursday’s US labor report the next key driver.


USD/CAD Respecting Trend Resistance
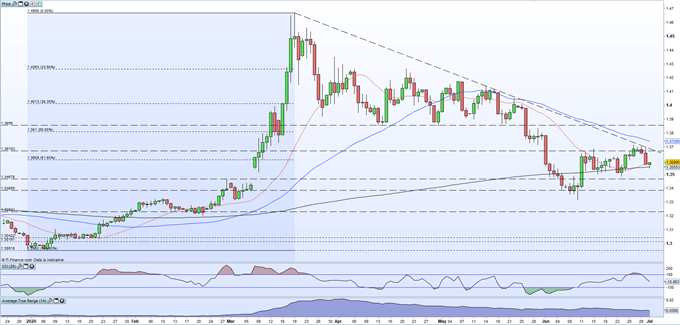
USD/CAD is now testing support off the 200-day moving average and may well re-test the June 23 low at 1.3484 if a break is confirmed. The pair are also being steered lower by multi-month trend resistance which held firm at 1.3702 yesterday before the pair sold off sharply after Canadian monthly GDP for April beat expectations and official commentary provided a positive outlook. While the -11.6% fall was the largest on record, Statistics Canada said that economic activity had picked up and ‘preliminary information indicates an approximate 3% increase for GDP in May’.
On Thursday, the latest US labor report (NFPs) will be released at 13.30 UK with the unemployment rate expected to fall to 12.3% from 13.3% in May. Last month’s NFP report shocked the market who were looking for an unemployment rate of near-20%, although the BLS did report that due to vagaries in some worker’s classification for the survey, then the unemployment rate ‘would have been about three percentage points higher than recorded’.
The daily USD/CAD chart shows the pair touching both the 20- and 200-dma today after once again rejecting multi-month trend resistance. A break and close below both these moving averages would open the way to the previously mentioned 1.3484 level before 1.3400 and 1.3316 come into view. The 200-dma has held for the last 2-3 weeks. To the upside, the 61.8% Fibonacci retracement level at 1.3608 may slow down the pair before trend resistance, currently around 1.3685, comes into play. Today’s trading range is small and the next break may not come until after tomorrow’s NFP release.
USD/CAD Daily Price Chart (December 2019 – July 1, 2020)

| Change in | Longs | Shorts | OI |
| Daily | -14% | 11% | -1% |
| Weekly | 44% | -18% | -1% |
What is your view on the Canadian Dollar – bullish or bearish?? You can let us know via the form at the end of this piece or you can contact the author via Twitter @nickcawley1.


