


HANG SENG, CHINA A50, MSCI EM INDEX OUTLOOK:
- Asian indices may open flat as US sanctions against the security law sour sentiment
- China A50 Index remains in an ascending channel; Caixin PMI beats forecast at 51.2
- The MSCI EM Index has likely formed a ‘double top’, signaling more consolidation
Hang Seng Index Outlook:
The Hong Kong stock market is closed for HKSAR Establishment day today, and the Hang Seng Index stock market index futures are pointing to a muted start. Investors in Asia are largely ignoring another cheerful session in the Wall Street, and cautiously assess the implications of US sanctions over Hong Kong.
China’s Caixin PMI in June came in at 51,2, smashing market expectation of 50.5 and previous month’s reading of 50.7. Alongside a string of upbeat Markit manufacturing PMIs from other Asian economies (discussed in later part), this marks a solid rebound in Asia’s manufacturing sentiment and will likely underpin Asian equity performance today.
The approval of a controversial Hong Kong security law seem set to undermine sentiment, as the US will soon end exports of defense and dual-use technologies to Hong Kong as it does for China. US Commerce Secretary Wilbur Ross said that “regulations affording preferential treatment to Hong Kong over China, including the availability of export license exceptions, are suspended.”
This probably marks an escalation of political tensions and protectionism between the world’s two largest economies, a relationship which is crucial to global trade and growth. A hawkish stance in Washington and Beijing around the new security law might manifest into a bearish signal on Hong Kong equities.
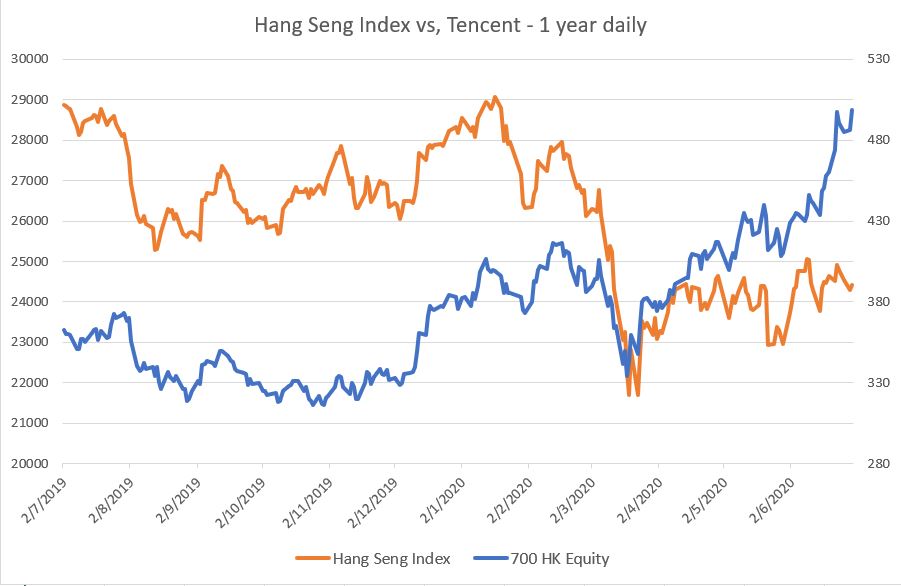
A breakdown of the Hang Seng Index’s performance yesterday reveals that technologyfirms are becoming the new safe-haven amid external headwinds. China’s gaming and technology giant Tencent (700 HK), which accounts for 11.3% of Hang Seng’s weighting, was doing the heavy lifting yesterday and contributing to 56% of the index’s gain. Tencent has largely outperformed the benchmark even despite India’s ban on Chinese apps. Tencent has soared 32% from March’s trough, dwarfing Hang Seng’s 10% gain during the same period (chart below).
Hang Seng Index –Technical Analysis
HSI found a strong support at 24,100 – the 38.2% Fibonacci retracement level. The index has been ranging between 24,000 – 25,000 for three weeks, failing to break out above the upper bound. Sideways trade seems set to continue in a thin liquidity week, with US markets closed on Friday for the Independence Day holiday.
A break below support at 24,000 may open room for more downside towards 23,000.

MSCI China A50 Outlook:
Fundamentally, the ratio of MSCI China Financials Index/MSCI China Index has dropped to its all-time low recently (chart below), largely due to the financial sector’s underperformance compared to technology, healthcare and consumer-linked names. Rising non-performing loans as a result of the Covid-19 pandemic and a slowdown in overseas demand are weighing on banks’ valuations.
Technically, The MSCI China A50 Index is riding an ascending channel since early March, and is facing some resistance at around 13,900. Today’s China Caixin PMI and tomorrow’s release of US non-farm payroll data are key events to drive the index’ next move.

MSCI EM Index Outlook:
A string of Asian Markit manufacturing PMIs will set the tone for Asia’s emerging market trading today. As shown in the chart below, Asia’s major emerging economies (ex-Japan) have rebounded sharply in May from the trough in April (chart below). June’s release will help gauge the depth of second-quarter fallout.

Source: Bloomberg, DailyFX
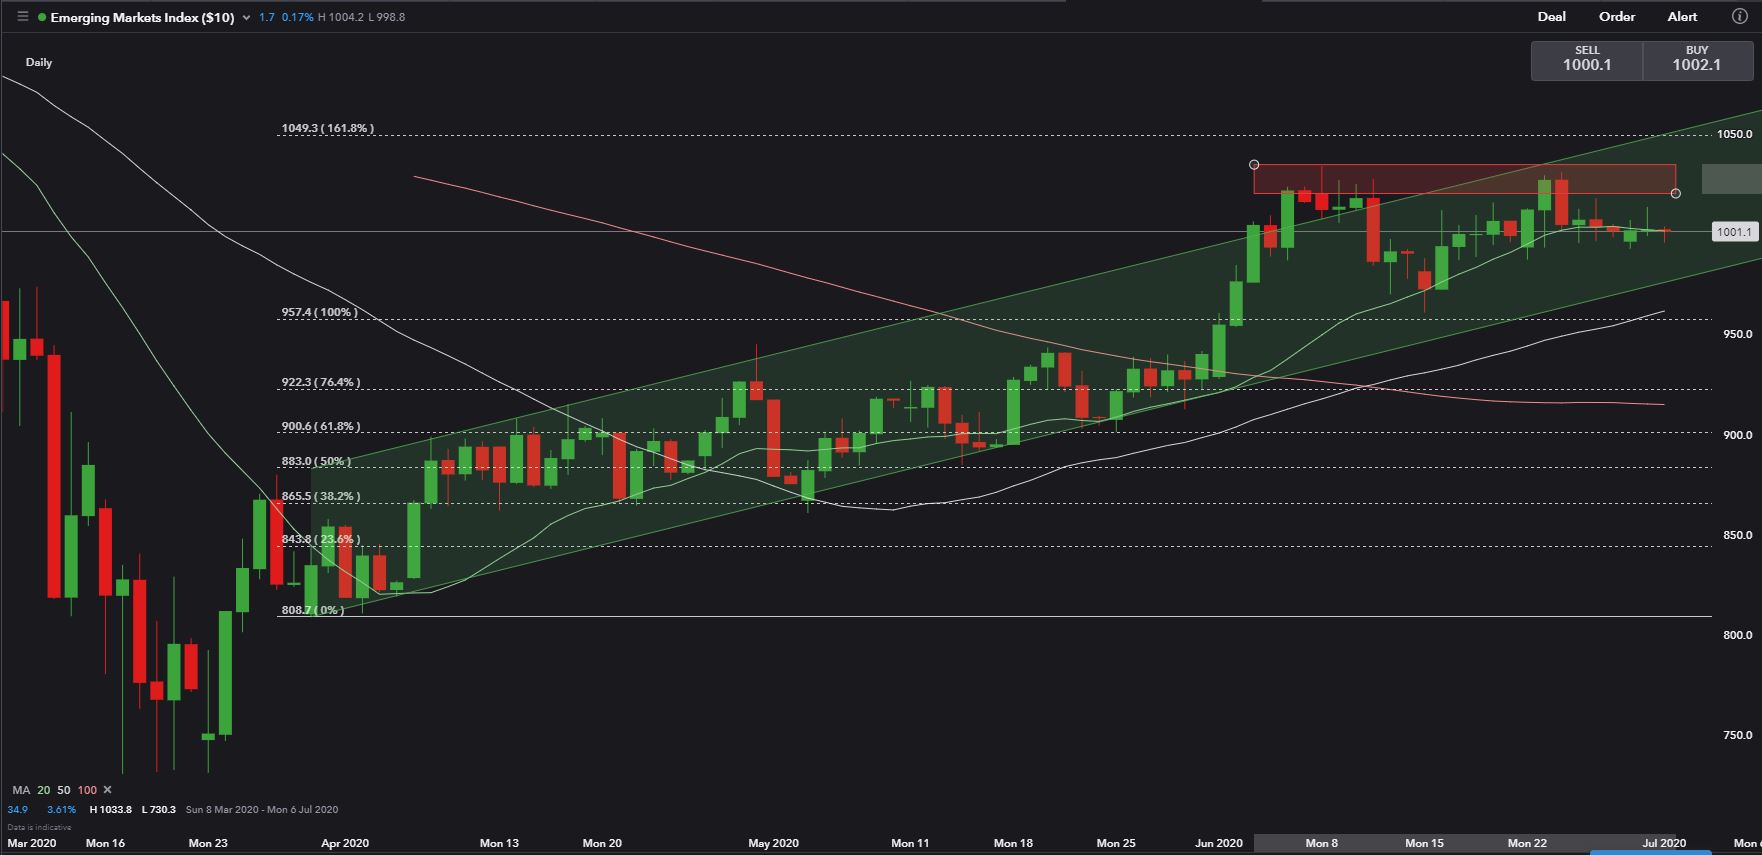
Technically, the MSCI EM Index has likely formed a double top at around 1,030, which now serves as a key resistance level. Its upward trend remains intact as highlighted in the green-color channel. A successful breakout above 1,030 will open room to more upside towards 1,050 – the 161.8% Fibonacci extension level.

--- Written by Margaret Yang, Strategist for DailyFX.com
To contact Margaret, use the Comments section below or @margaretyjy on Twitter


