Nasdaq 100 Price Forecast:
- The Nasdaq posted a quarterly return of roughly 30% and surpassed key psychological levels
- Few markets were more aggressive in their recovery than the tech-heavy index
- Still, surging coronavirus cases may give pause to a continuation higher
Nasdaq 100 Forecast: Stocks Post Stellar Quarterly Gains Led by Tech
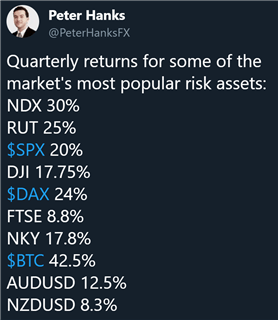
Markets closed higher on Tuesday to finish out the second quarter on a high note, despite soaring coronavirus cases and immense economic uncertainty. The S&P 500 and Dow Jones registered their highest quarterly returns since 1998 and 1987 respectively, while the Nasdaq 100 posted its best quarterly return since 1999. In order of appearance, the major US indices returned roughly 19.95%, 17.75% and 30% while the Russell 2000 posted a gain of 25%.

Source: Investing.com and @PeterHanksFX
While many stocks, sectors and indices remain negative in the year-to-date alongside other key risk assets, the Nasdaq 100 is one of the few outliers as it has been dragged higher by just a handful of powerful components. Enjoying a staggering 14.5% gain since January 1, it is easy to see the Nasdaq’s leadership in the demand for risk exposure. To that end, there is little reason to suggest the Nasdaq 100 will not continue to lead other growth-sensitive assets in the coming quarter.
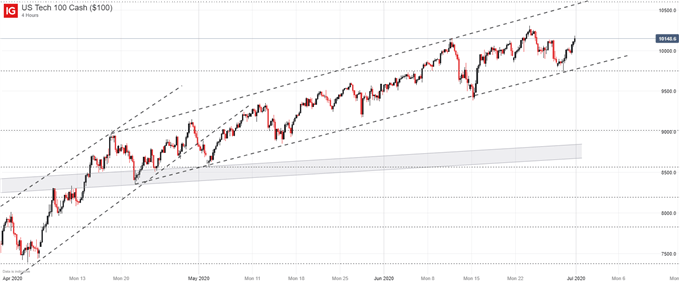
Nasdaq 100 Price Chart: 4 – Hour Time Frame (April 2020 – July 2020)

With that in mind, avoiding the development of concerning technical patterns – like the formations that exist on the Dow Jones and S&P 500 – may be key in building a continuation higher. Therefore, the nearby Fibonacci level at 9,752 which roughly coincides with the lower-bound of an ascending channel projection may prove crucial in keeping the tech-heavy index afloat.


Should price break beneath, losses could accelerate and such a development would merit a serious reconsideration of the technical outlook. In the meantime, however, the technical landscape would suggest the Nasdaq is rather comfortable trading within the confines of the channel, even as the Dow and S&P 500 begin to hint at weakness.
--Written by Peter Hanks, Analyst for DailyFX.com
Contact and follow Peter on Twitter @PeterHanksFX


