


STOCK MARKET OUTLOOK: S&P 500 INDEX DEFENDS 3,000-PRICE LEVEL AS CRUDE OIL REBOUNDS, VIX ‘FEAR-GAGE’ RECEDES
- Stock market benchmarks like the S&P 500, Dow Jones, Nasdaq surge to start the trading week
- Crude oil price action advances despite halted reopening measures as new virus cases spike
- VIX Index takes a tumble ahead of high-impact event risk and economic data releases on deck
Stocks are trading on their front-foot following a sluggish start to Monday’s session and last week’s volatile market conditions. Throughout the month of June, stock market bulls and bears have battled over key technical barriers, which leaves S&P 500 performance roughly flat month-to-date.
| Change in | Longs | Shorts | OI |
| Daily | 1% | -6% | -3% |
| Weekly | 34% | -25% | -4% |
This comes amid lingering investor uncertainty as coronavirus optimism stalls owing to a recent explosion in the number of new virus cases. However, the lack of rising hospitalizations and mortality rates provide conflicting, though encouraging, anecdotal evidence that likely facilitates the rebound in consumer confidence and a stable economic recovery.
S&P 500 INDEX PRICE CHART, CRUDE OIL OVERLAID: 1-HOUR TIME FRAME (24 APR TO 29 JUN 2020)
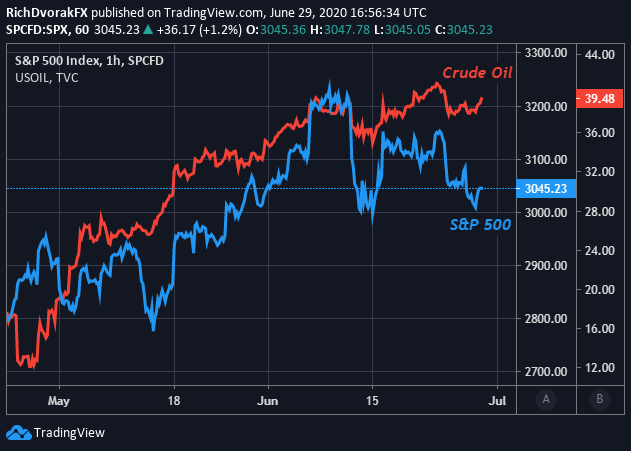
Chart created by @RichDvorakFX with TradingView
That said, perhaps the direction of crude oil price action could serve as a bellwether to where the S&P 500 index heads next. This is considering the price of crude oil tends to react violently to changes in global GDP growth outlook, which is often associated with a material impact on crude oil demand broadly following the ebb and flow of business activity.

S&P 500 PRICE CHART, VIX INDEX OVERLAID: 5-MINUTE TIME FRAME (25 JUN TO 29 JUN 2020)
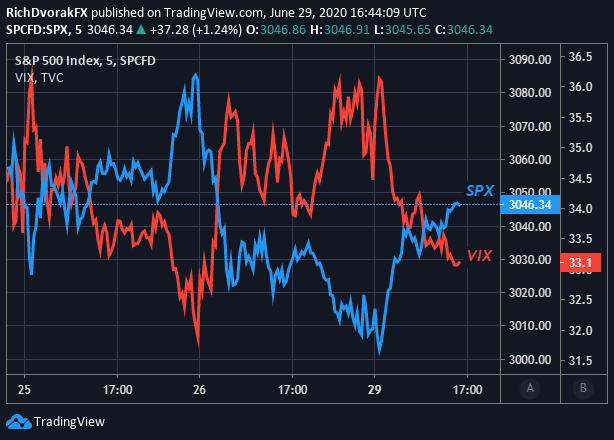
Chart created by @RichDvorakFX with TradingView
If local governments continue to back-track on their coronavirus lockdown reopening guidelines amid rising second wave risk, or if major companies like Apple voluntarily announce more store closures, there is potential for a bearish reaction in both crude oil as well as the S&P 500 due to this rekindled market threat and lingering public health pandemic.

Investor sentiment correspondingly remains vulnerable as suggested by the relatively ‘sticky’ S&P 500 VIX Index. Nevertheless, a string of high-impact event risk and data releases scheduled on the economic calendar this week, such as monthly reports on consumer confidence or nonfarm payrolls, have serious potential of weighing on stocks and crude oil price action.
Keep Reading – Gold Price Eyes Jobless Claims Data as New Virus Cases Spike
-- Written by Rich Dvorak, Analyst for DailyFX.com
Connect with @RichDvorakFX on Twitter for real-time market insight


