


Dow Jones, Nasdaq 100, S&P 500 Price Outlook:
- While the Dow Jones and S&P 500 struggle with capturing prior highs, the Nasdaq 100 presses higher
- Just five tech stocks are responsible for much of the recovery rally and the concentration in these stocks has never been higher
- Elsewhere, emerging technical patterns on the Dow and S&P 500 might be a sign of weakness ahead
Dow Jones, Nasdaq 100, S&P 500 Forecasts: Stocks Pulled Higher by Tech
Although some market pundits and online forums have adopted the belief that “stocks only go up,” Wednesday’s price action dealt a blow to the recently popularized mantra and a deeper look at what has lead stocks higher in recent months might suggest that, in fact, only a few stocks are responsible for the majority of gains. The stocks in question are none other than the five largest corporations listed on the Nasdaq 100 index, namely Apple, Microsoft, Amazon, Google and Facebook.
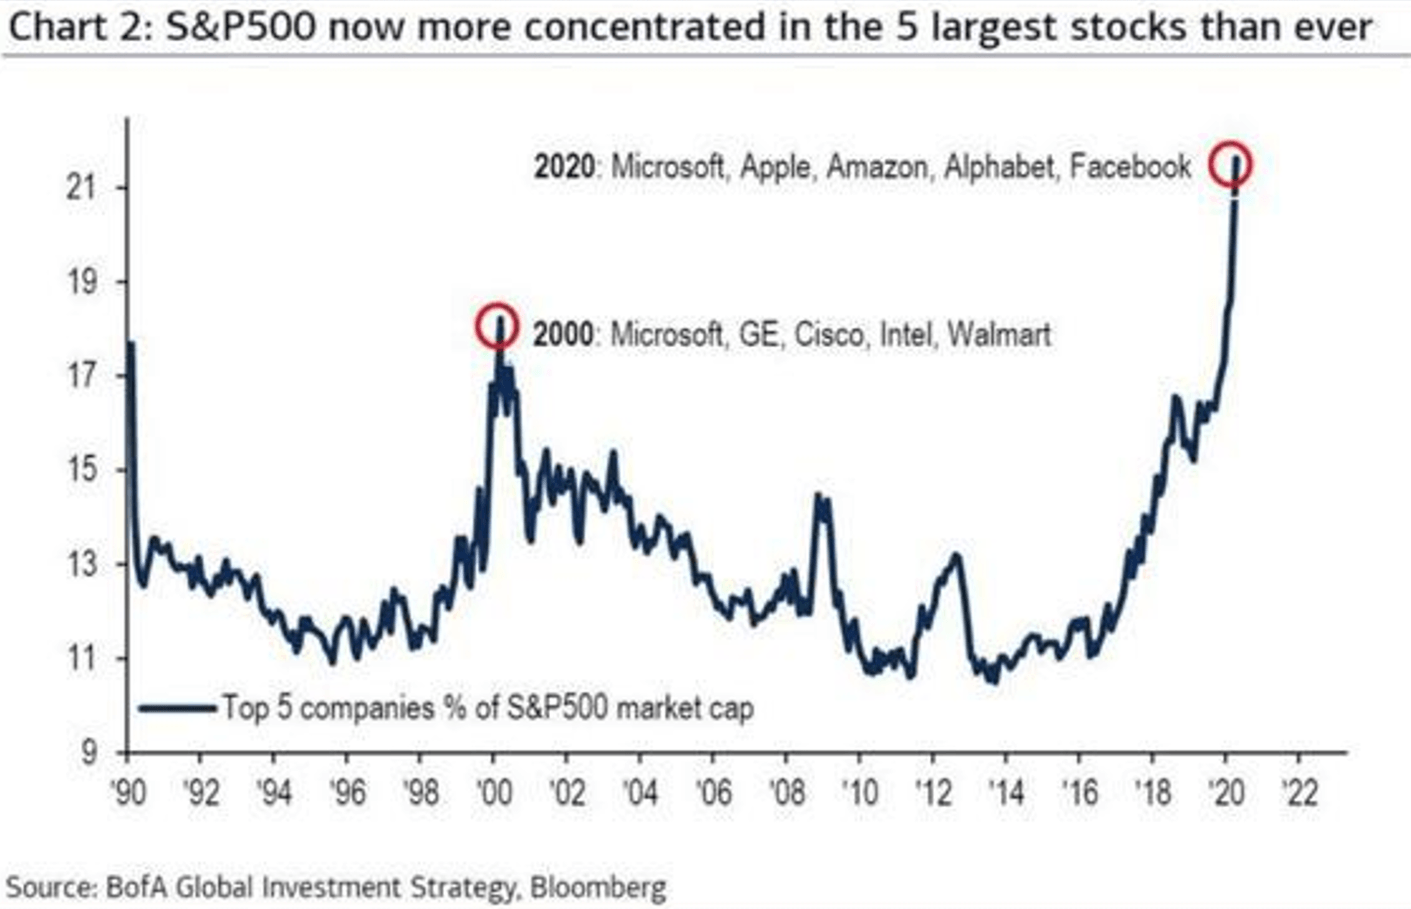
Together, these companies account for roughly 45% of the Nasdaq and the market’s exposure to the five largest stocks on the S&P 500 has never been higher – even during the height of the Dot Com bubble. While it can be argued the outperformance of these select stocks is warranted to some degree, it is an entirely difficult discussion to claim a continuation higher for the broader market is a given due to a few well positioned corporations.
To be sure, a high concentration in a handful of stocks is a common occurrence and it can persist for some time, but I am hesitant to suggest this degree is sustainable in the long term. Similarly, there is little to suggest stocks have already reached their zenith as investors continue to enjoy the prospect of an accommodative Federal Reserve.
{{FOREX_FOR_BEGINNERS}}
Nasdaq 100 Technical Outlook
With the main drivers of the recovery rally understood, it is rather unsurprising to see the Nasdaq 100 at the forefront of risk appetite. Further still, the tech-heavy index has enjoyed a relatively encouraging technical backdrop because of its leadership, whereas the Dow Jones and S&P 500 have begun to show signs of weakness.
Nasdaq 100 Price Chart: 4 – Hour Time Frame (February – June)

Dow Jones Technical Outlook
While the Nasdaq has recently established a new high, the Dow Jones remains a laggard and recent price action reveals building potential for a lower-low. Thus, holding above the Fibonacci level at 25,220 and the subsequent June swing-low at 24,565 may prove pivotal for the technical outlook of the industrial average. A break below 24,565 would signify a significant technical downgrade, in my opinion, and would open the door to further losses as it would work to establish a visible downtrend from the June peak.
Dow Jones Price Chart: 4 – Hour Time Frame (February – June)

S&P 500 Technical Outlook
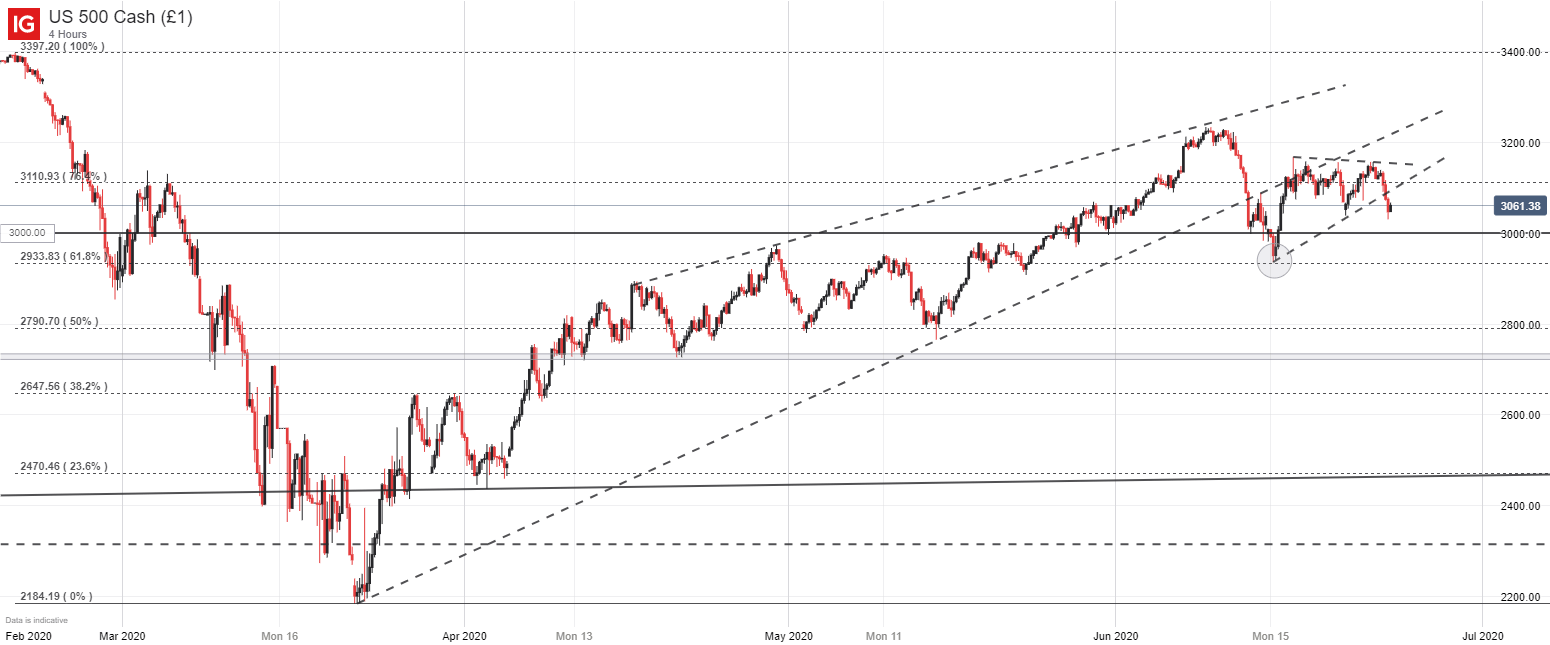
Much of the same can be said for the S&P 500 which also runs the risk of a new lower-low after posting a series of failed attempts higher over the last two weeks. Without a fresh break above the June crest, the most important technical level for the S&P 500 may be the June swing-low at 2,933. A move to this level would see the index cross the psychologically significant 3,000 mark and progress the formation of a bearish technical pattern.
S&P 500 Price Chart: 4 – Hour Time Frame (February – June)
While it is hard to argue the Nasdaq is not in the driver’s seat from a sentiment and price discovery perspective, the weakening technical outlooks on both the Dow Jones and S&P 500 should not be ignored. As it stands, fears of a second coronavirus wave seem to be the driving bearish factor, so swings in sentiment will likely be derived from the progression of that theme.
Either way, recent volatility and an inability for indices – other than the Nasdaq – to establish fresh highs in June could be a sign of waning bullish appetite in the coming weeks. In the meantime, follow @PeterHanksFX on Twitter for updates.
--Written by Peter Hanks, Analyst for DailyFX.com
Contact and follow Peter on Twitter @PeterHanksFX


