


GBP/USD, EUR/GBP and FTSE 100 – Prices, Charts and Analysis:
- Sterling remains under pressure.
- FTSE 100 nudging higher but trade remains muted.

A quiet week on the economic calendar but political risk may still move markets in the days ahead. In the UK, the government is expected to announce that it will cut the two-metre social distancing rule in half tomorrow so the hospitality sector can re-open on July 4. COVID-19 outbreaks in the US and Germany is keeping a lid on risk.
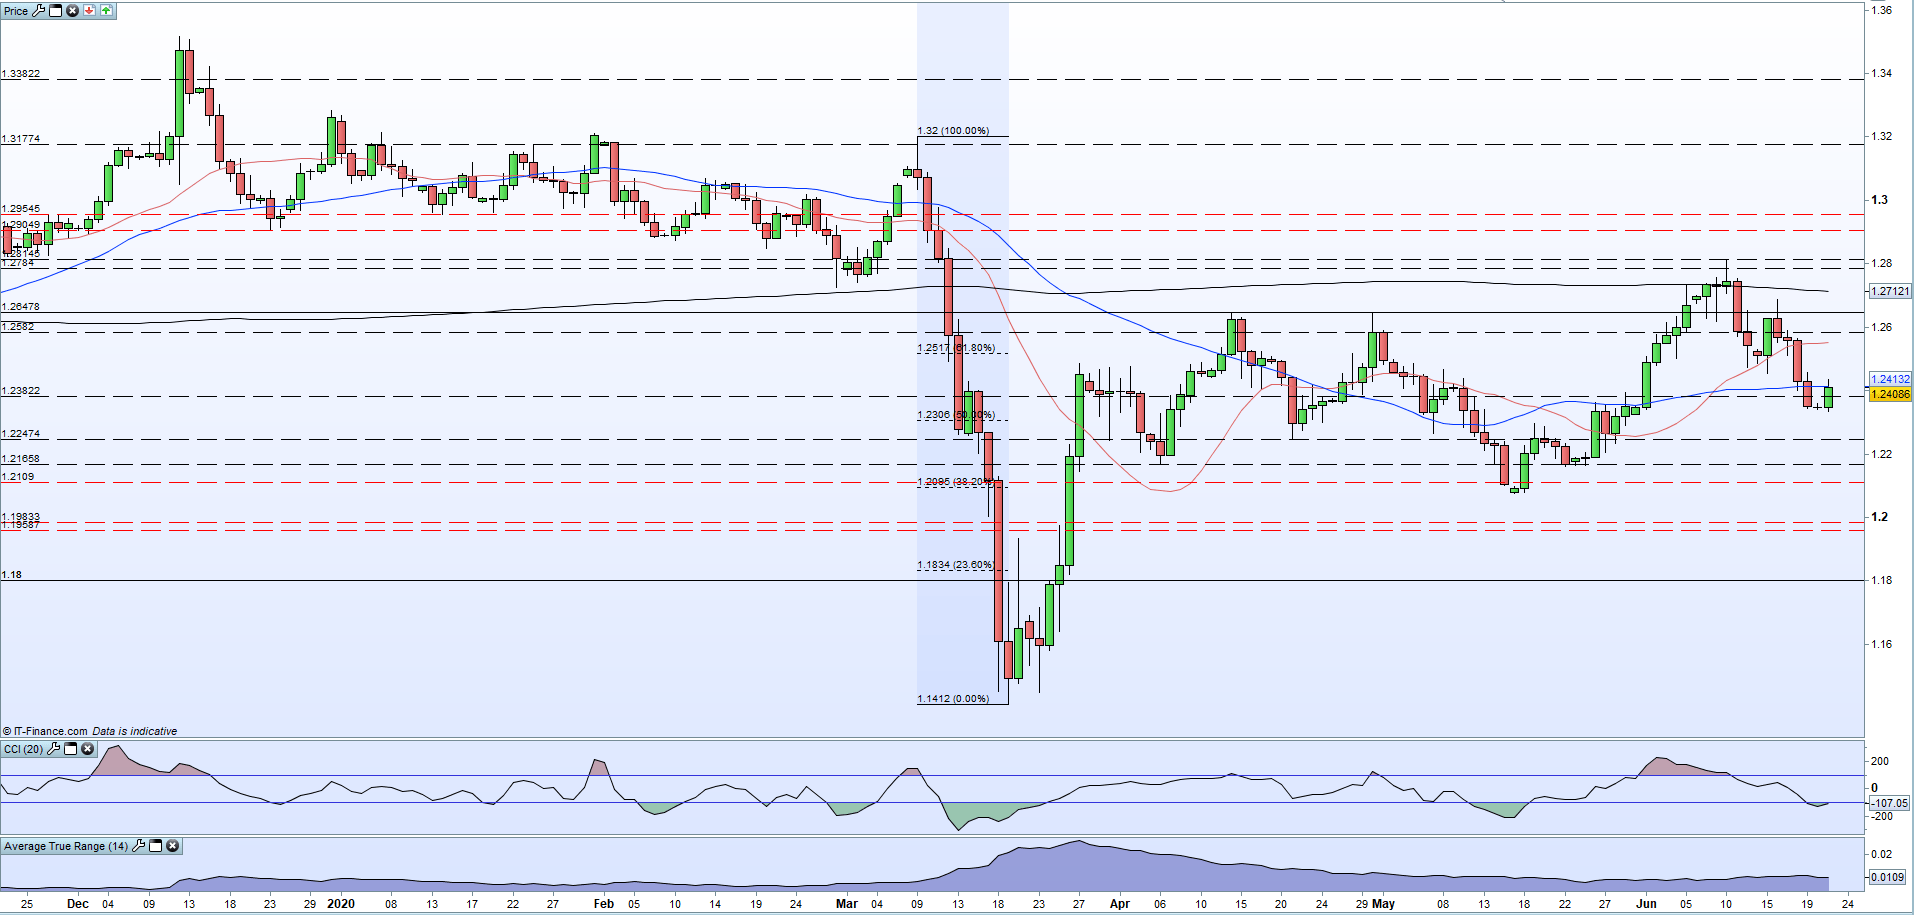
GBPUSD trades either side of 1.2400 after Friday’s sell-off and any push higher is being met by resistance. The 50-dma is blocking the upside and needs to be broken and opened above before the short-term target of 1.2517 comes into play. Support starts at 1.2306 just ahead of the big figure.
GBP/USD Daily Price Chart (December 2019 – June 22, 2020)
| Change in | Longs | Shorts | OI |
| Daily | 0% | 4% | 1% |
| Weekly | -4% | 13% | 1% |
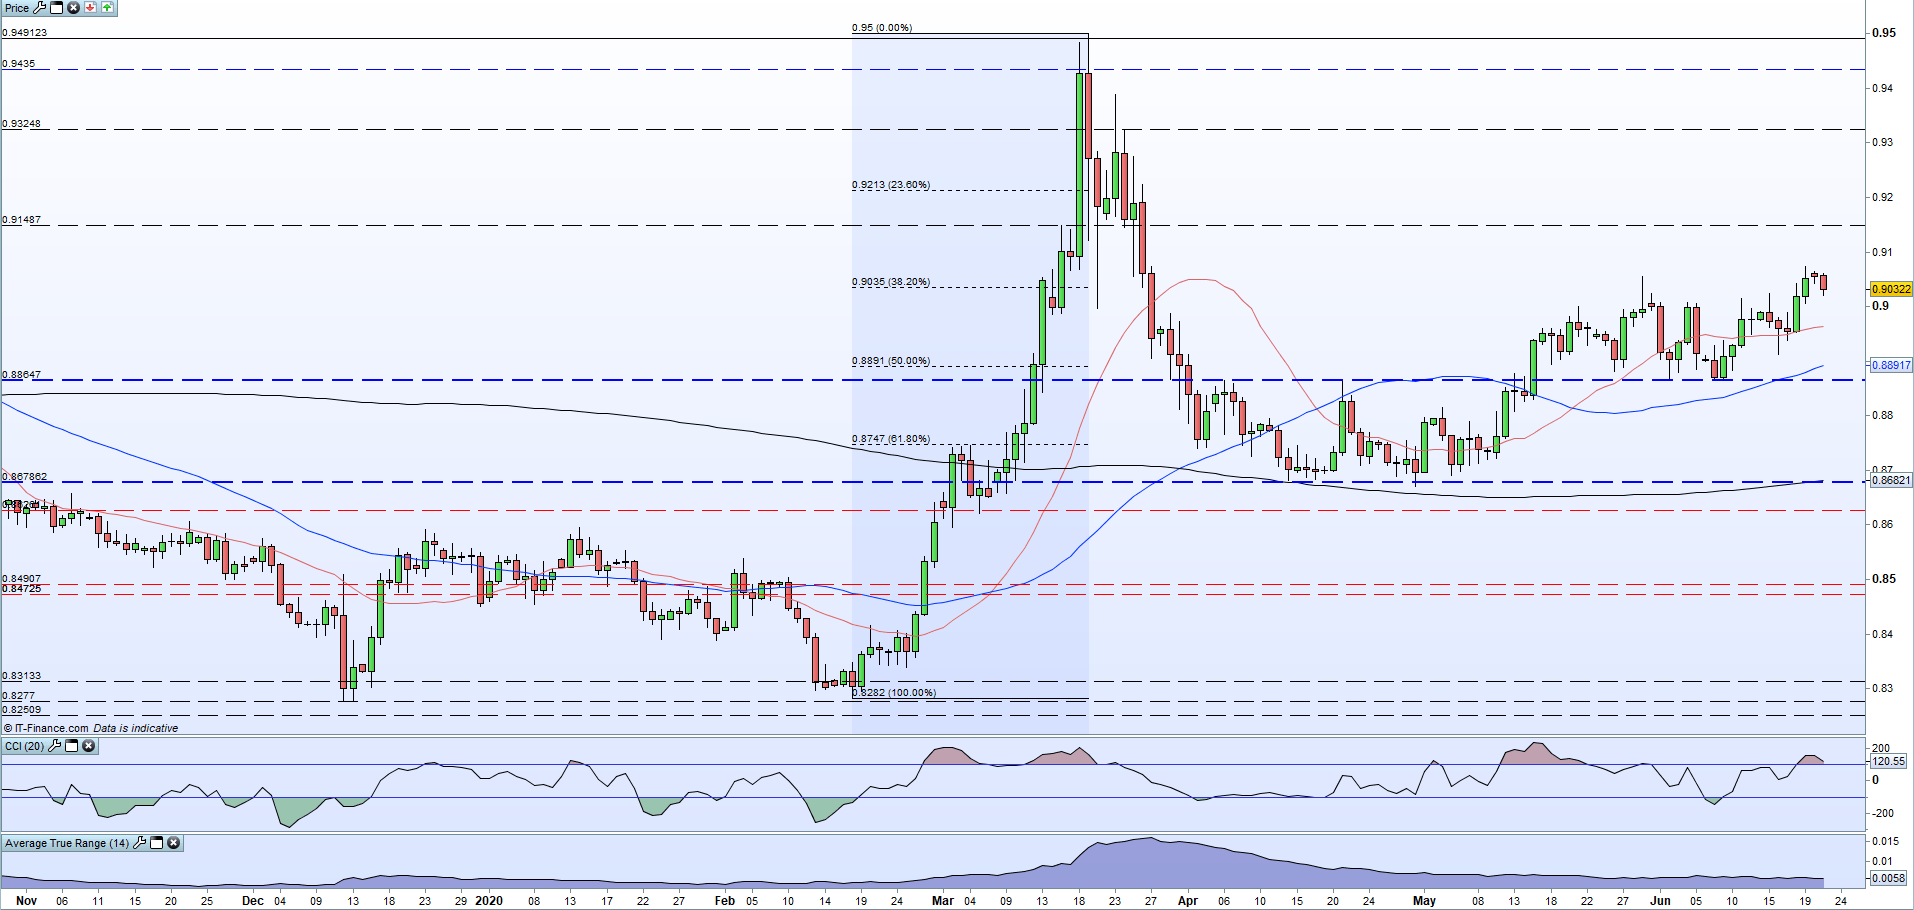
EUR/GBP broke above resistance on Friday but has failed to keep its gains today. All three moving averages remain positive for the pair although the CCI indicator is flashing an overbought warning. Support starts around 0.9000 to 0.9009 while a close above 0.9035 and 0.9055 is needed to keep the bulls interested.
EUR/GBP Daily Price Chart (December 2019 – June 22, 2020)
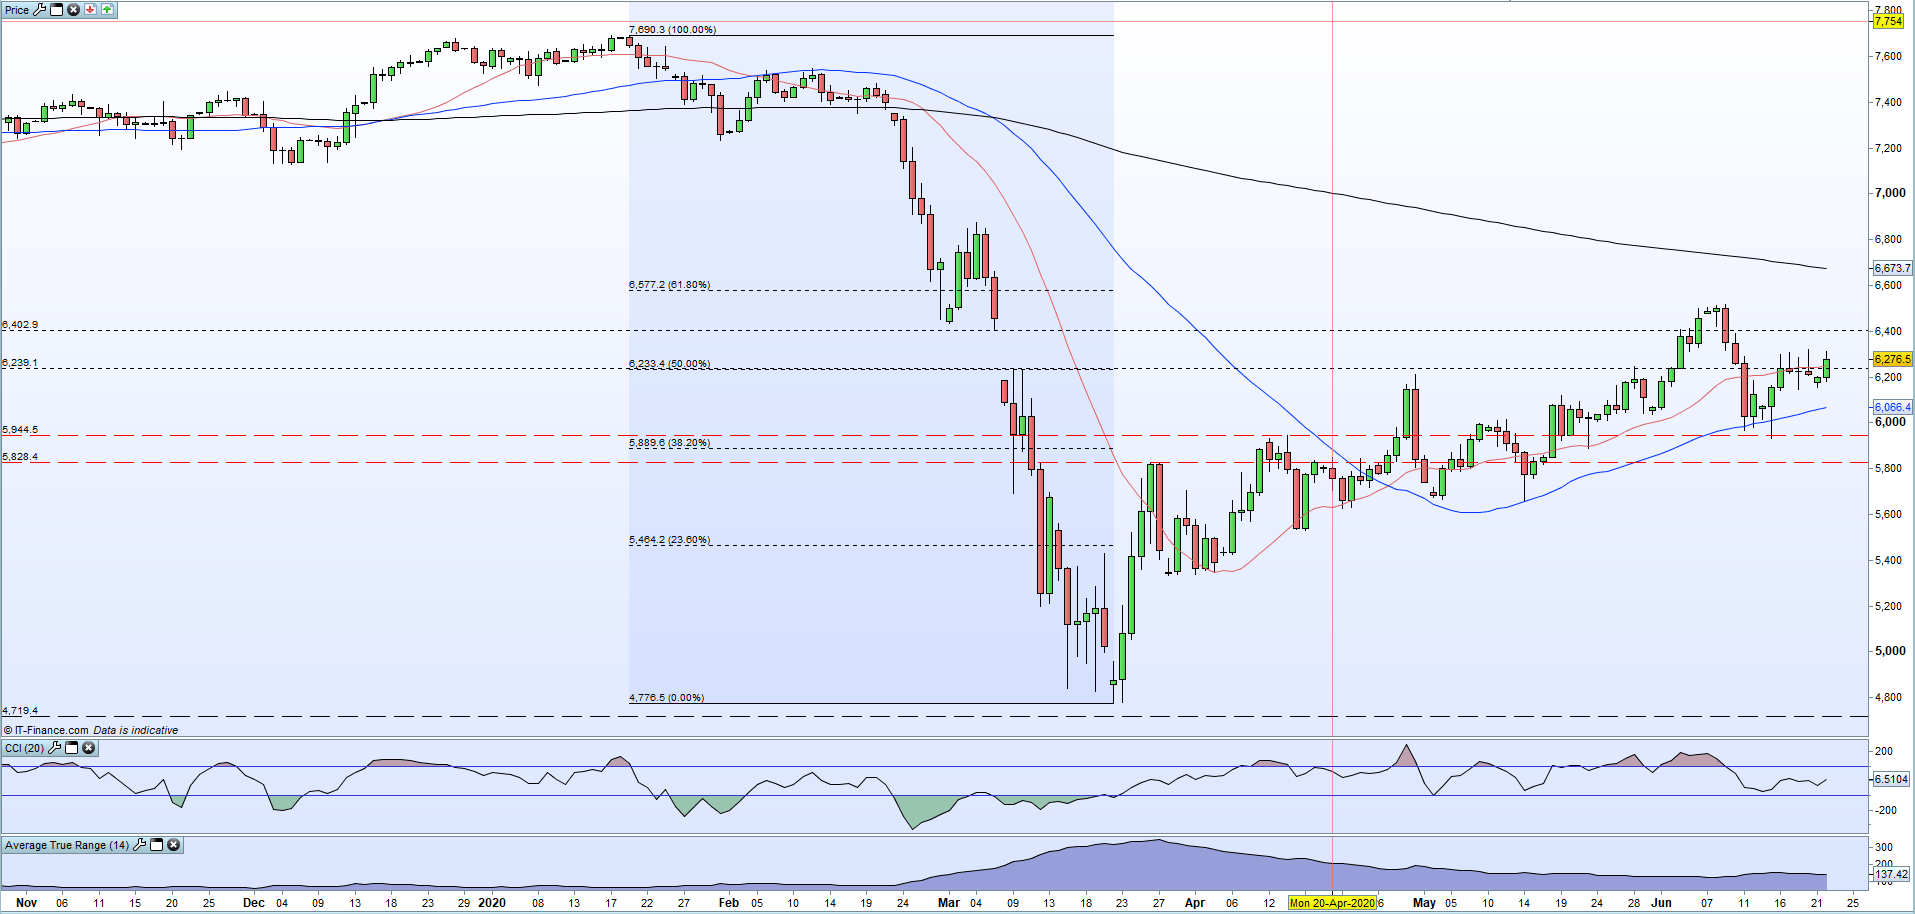
The FTSE 100 is consolidating around the 50% Fibonacci retracement level at 6,233 and the 20-day moving average just 20 points higher. Initial support around 6,140 while resistance from a handful of old highs up to 6,320.
FTSE 100 Daily Price Chart (December 2019 – June 22, 2020)
Traders of all levels and abilities will find something to help them make more informed decisions in the new and improved DailyFX Trading Education Centre
What is your view on Sterling (GBP) and the FTSE 100 – bullish or bearish?? You can let us know via the form at the end of this piece or you can contact the author via Twitter @nickcawley1.


