


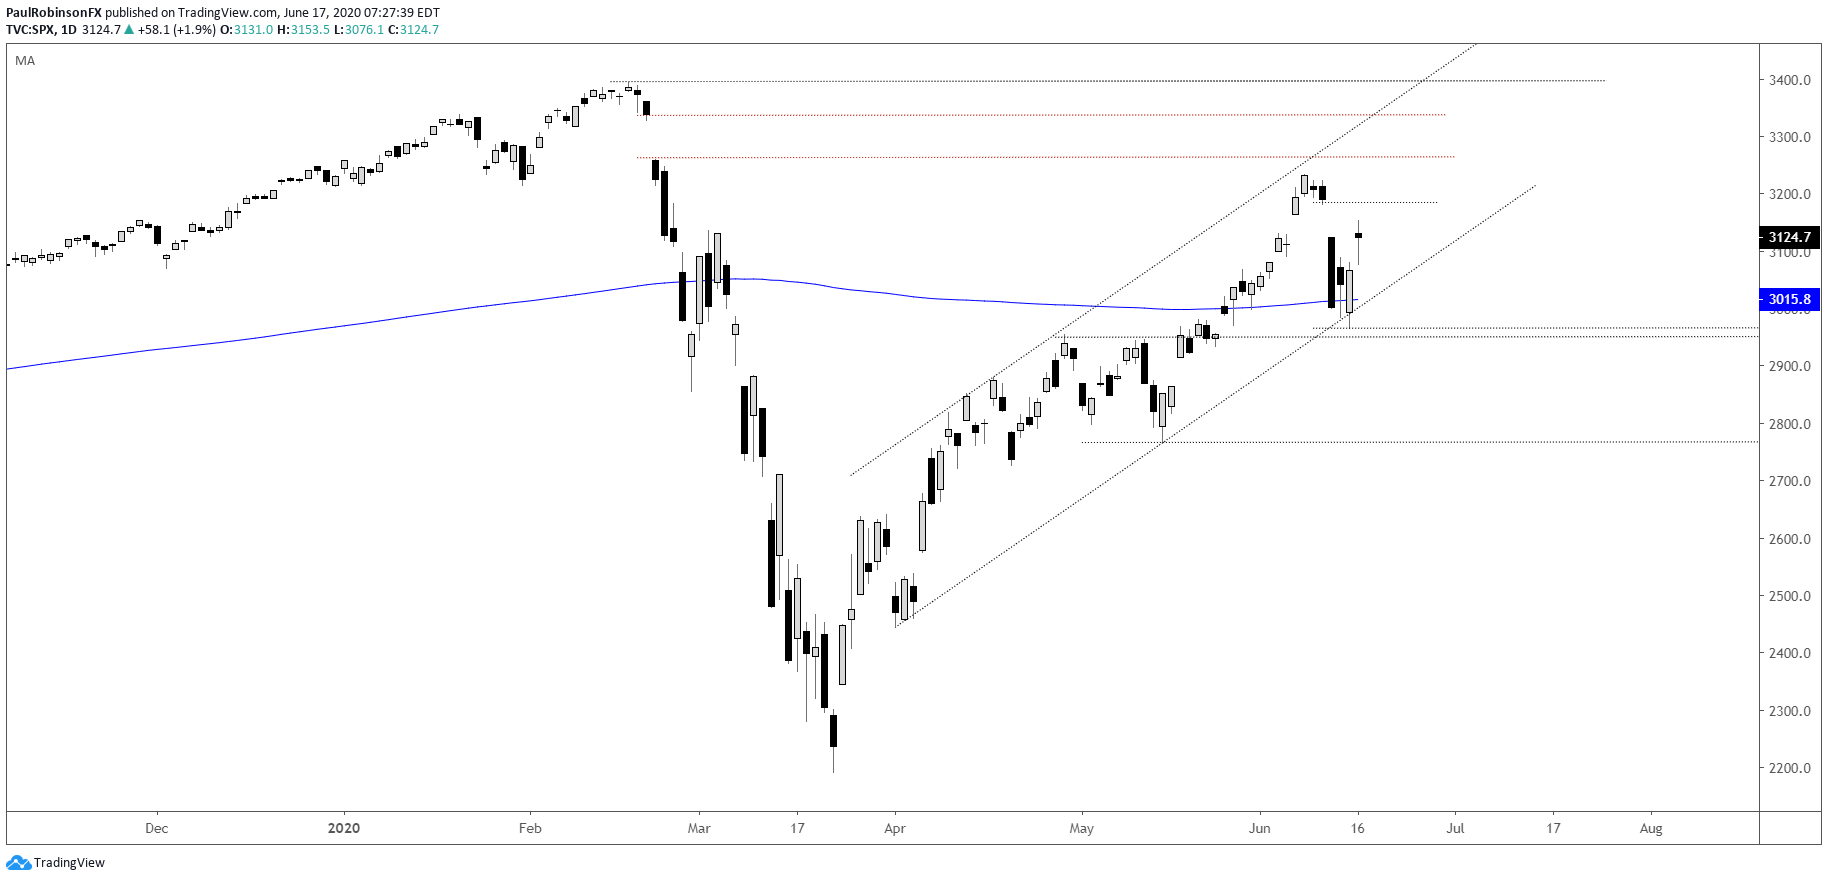
The S&P 500 is coming strongly off the 200-day and a trend-line from April following an even stronger one-day down-move. The question is whether that was the pullback, the one-day move, or whether we will see the current bounce fail and lower prices. In any event, there is good confluent support via the 200-day MA and trend-line, so as long as it can stay above support the outlook is neutral to bullish. A break below 2965 will be needed to get the SPX rolling downhill.
Keep an eye on the all-important NDX as it stays maintained in an upward sloping channel from April. It just came off the top of a 10-year channel and 10k, so it could at some point break the upward sloping structure. A decline below 9499 is need to get the index rolling downhill.

S&P 500 Daily Chart (watch confluent support)
Nasdaq 100 Daily Chart (channel is the guide)

Nasdaq 100 Chart by TradingView
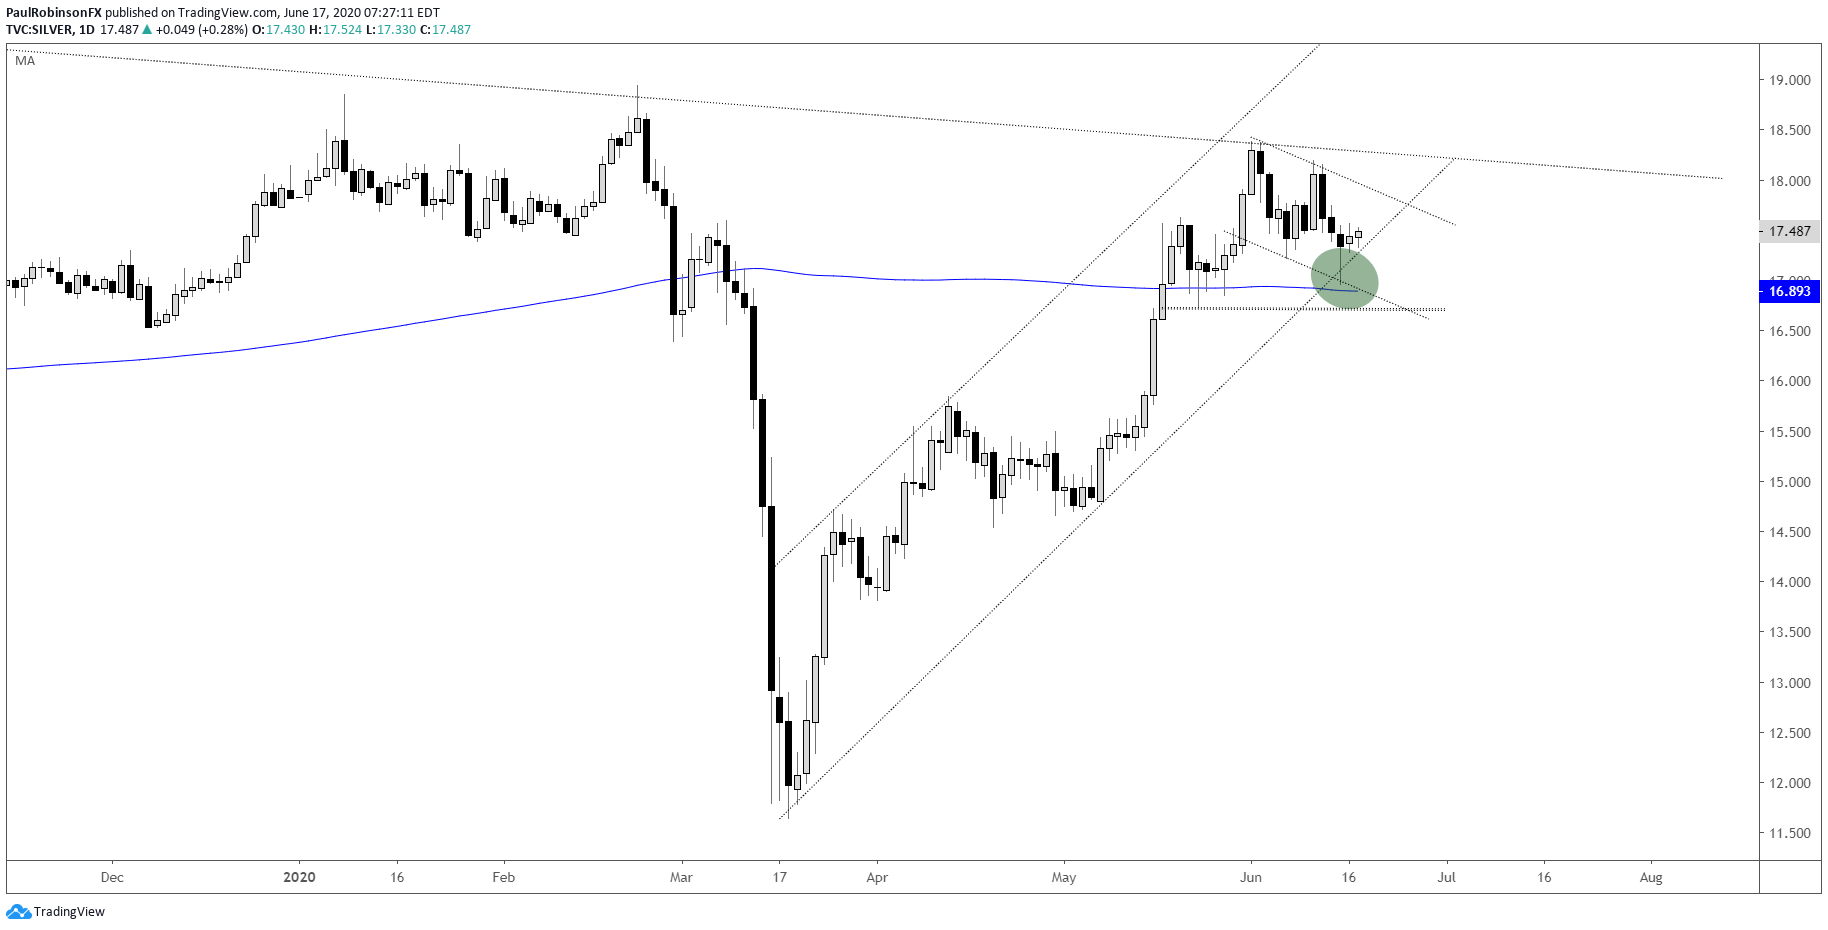
Silveris trying to hold onto an area of confluent support via the 200-day MA and rising trend-line. It turned off of it on Monday and is now working on making good on the reversal. There is overhead trend-line resistance, but overall the outlook at the moment bodes well for continued strength. A break below 16.72 will take this outlook off the table.
Silver Daily Chart (trying to rise from confluent support)
To see all the charts we looked at, check out the video above…
Resources for Index & Commodity Traders
Whether you are a new or an experienced trader, DailyFX has several resources available to help you; indicator for tracking trader sentiment, quarterly trading forecasts, analytical and educational webinars held daily, and trading guides to help you improve trading performance.
We also have a series of guides for those looking to trade specific markets, such as the S&P 500, Dow, DAX, gold, silver, crude oil, and copper.
---Written by Paul Robinson, Market Analyst
You can follow Paul on Twitter at @PaulRobinsonFX


