


Nasdaq 100 Price Forecast:
- The Nasdaq breached the psychologically significant 10,000 mark for the first time ever last week
- The record was immediately followed by a steep retracement lower that saw the Nasdaq pierce both sides of the ascending channel that has guided it higher since April
- With an uptick in volatility and a weakened technical pattern, the Nasdaq 100 runs the risk of further instability
Nasdaq 100 Forecast for the Week: Technical Patterns Weakened
The Nasdaq 100 scored an incredible achievement last week as the tech-heavy index broke above 10,000 for the first time in history. Still, the milestone was unable to ward off risk aversion as market participants underwent a shift in sentiment following the June 10 FOMC rate decision. The change in attitude gave way to a precipitous decline that was reminiscent of price action in February and March. As a result, the ascending channel that had helped guide the index higher since April suffered a topside breach followed by an almost immediate break lower, both of which work to erode the pattern’s structure.
Nasdaq 100 Price Chart: 4 – Hour Time Frame (February – June)
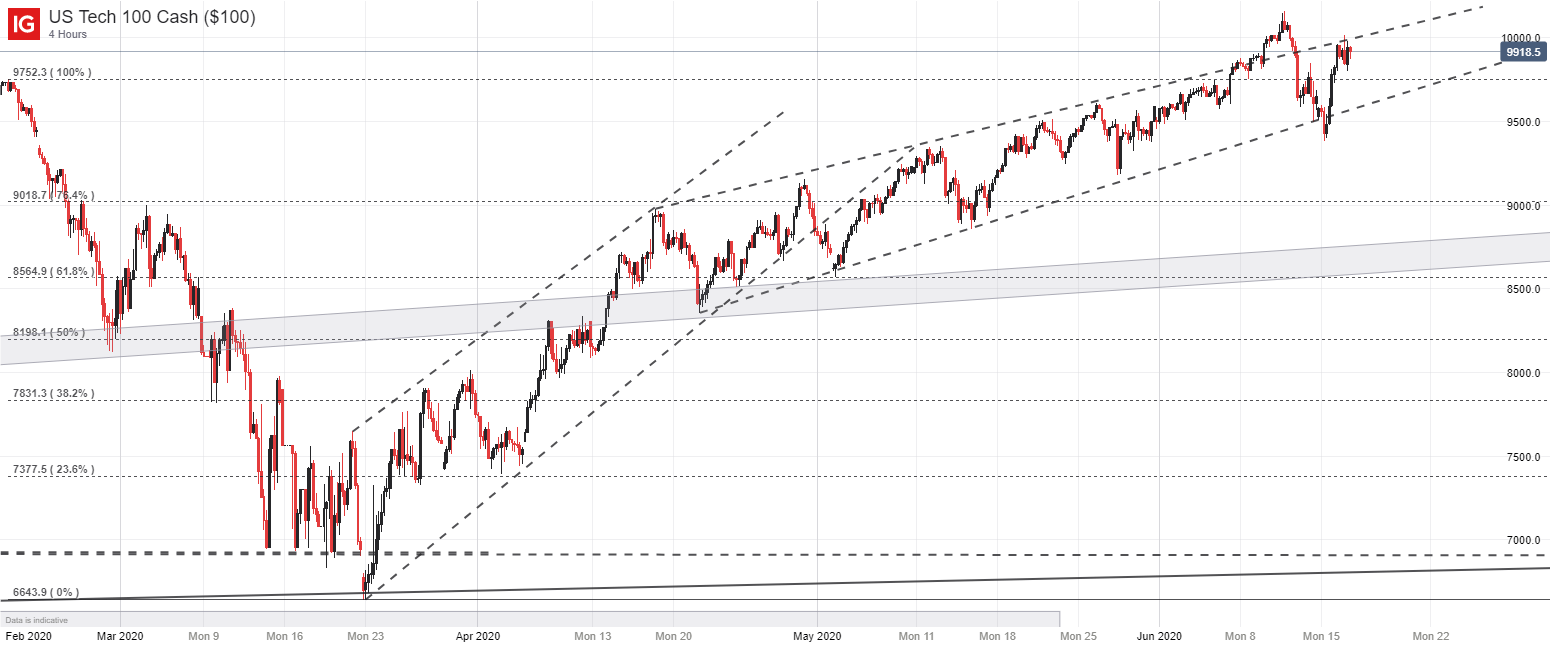
Consequently, the formation has been badly damaged and it may provide less guidance going forward. In the bullish case, having fewer topside barriers is rarely a problem, but the weakened lower-bound may allow for a subsequent selloff to explore lower. Further still, recent price action does not speak to stability as 2,000-point swings on the Dow Jones hardly inspire confidence. Thus, we are left with what is arguably a more-fragile Nasdaq 100 compared to early last week – despite a relatively modest change in price.

In conjunction with an uncertain fundamental backdrop, as I have long warned, the risk-reward profile of the Nasdaq 100 in its current state is skewed to the downside in my opinion. Perhaps the technical formation will give way to a larger ascending channel and volatility will become more common, as it has been in the past, but again, volatility speaks to the pace of price, rather than its direction.
With that in mind, another bullish break above 10,000 followed by a successful hold of ascending support nearby might be the most encouraging possibility at this stage. On the other hand, a bearish resurgence may see support probed at 9,752 before secondary and tertiary levels at 9,385 and 9,018 come into play. If price begins to cascade through support quickly, it may allow for losses to accelerate. In the meantime, follow @PeterHanksFX on Twitter for updates.
--Written by Peter Hanks, Analyst for DailyFX.com
Contact and follow Peter on Twitter @PeterHanksFX


