


Canadian Dollar, USD/CAD, CAD/JPY Talking Points
- Canadian Dollar retreating from 3-month highs as US Dollar gains
- USD/CAD surges out of oversold territory after filling breakaway gap from March.
- CAD/JPY capitulates after fulfilling measured move, RSI snaps 12-week uptrend
Canadian Dollar Index Weekly Chart
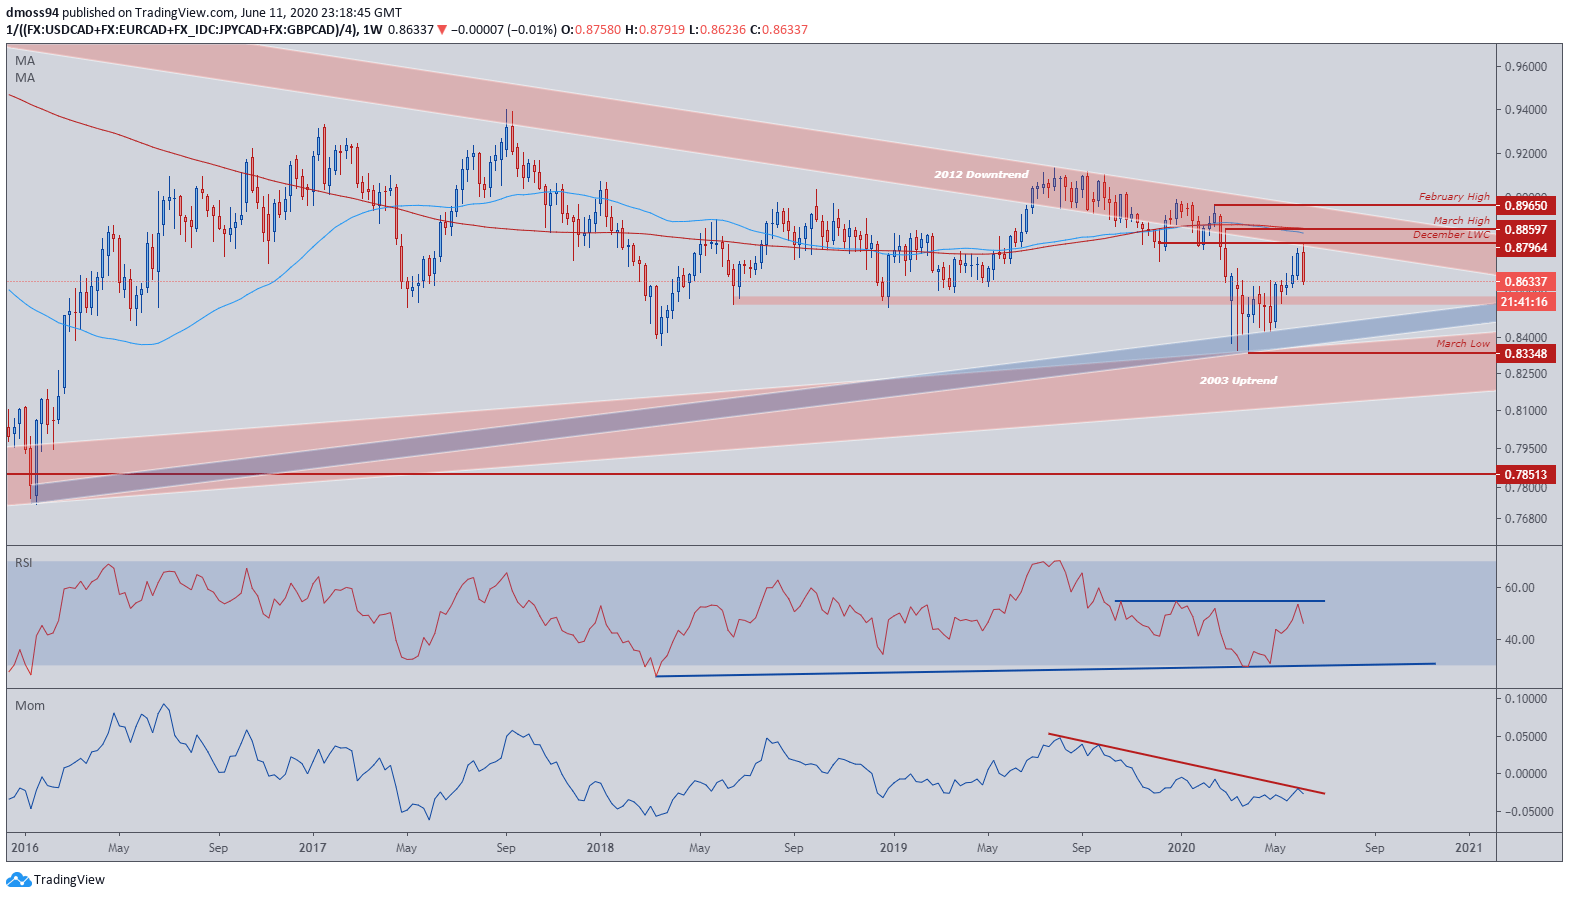
Source – Trading View
The Canadian Dollar has recovered against its major counterparts, with the CAD weighted index climbing as much as 5.5% from the March low (0.8335).
However, an 8-year trendline may come into play as a bearish engulfing candle formation takes shape at the December low-weekly-close (0.8796), with the price action possibly signalling an end to an 11-week rally.
The reaction in the RSI reinforces the bearish bias as the oscillator fails to break above resistance that has successfully capped topside momentum since October 2019.
Furthermore, the momentum indicator remains confined by an 11-month downtrend, which could continue to fuel the decline towards support at the 2003 uptrend.
A break and close below the December 2018 lows (0.8530 – 0.8570) may see the commodity-linked currency carve a path back to the yearly low (0.8335).

USD/CAD Price Daily Chart

Source – Trading View
Finally closing the break-away gap from May 6 pushed the USD/CAD into oversold conditions for the first time since late-December 2019.
However, the dip below 30 in the RSI was short lived as USD/CAD reverses from the December high (1.3325), with the exchange rate pushing back above the 200-day moving average (1.3576) to test the 2018 high (1.3665).
Nevertheless, USD/CAD remains constricted within a descending channel, and the formation suggests the recent rally could be temporary in nature, with a possible retest of parallel resistance coinciding with a pullback to the 6-month trend that was broken at the start of June.
The 50-MA (1.3790) may provide a challenge for USD/CAD bulls, with the convergence of channel resistance and the 50% Fibonacci (1.3810) pivotal in keeping the downward trending channel intact.
Development of the Relative Strength Index (RSI) hints that USD may surge against its Canadian counterpart, with the oscillator’s previous journey into oversold conditions at the start of 2020 resulting in a 13% surge to set the yearly high (1.4667).
The momentum indicator may highlight a similar dynamic should it snap the 3-month downtrend, with a daily close above the psychologically imposing 1.38-handle paving the way for USD/CAD to work its way toward the resistance zone at the May highs (1.4150 – 1.4200).
CAD/JPY Price Daily Chart

Source – Trading View
The haven-associated Japanese Yen has strengthened significantly against the Canadian Dollar over the last week of trade, after the exchange surged 7.33% failing just shy of the psychologically-imposing 82-handle.
Fulfilling the Symmetrical Triangle measured move pushed the RSI into overbought territory for the first time since 2018 and may signal the end of the rally from the May low (74.78).
Bears seem to be back in control as price snaps 4-week uptrend support, with the 38.2% Fibonacci (77.98) and monthly low (78.03) attempting to stop the risk-linked CAD/JPY’s slide.
With the RSI and momentum indicators both testing support from the March lows, a break of their respective constructive trends may accelerate the downside push.
A daily close below the 38.2% Fibonacci (77.98) could bring the 77-handle into play, with 23.6% Fibonacci (76.38) the next key level of interest.
-- Written by Daniel Moss
Follow me on Twitter @DanielGMoss


