Technical Outlook:
- US Dollar Index (DXY) coming off trend support
- S&P 500 turn down was unusually strong for a correction
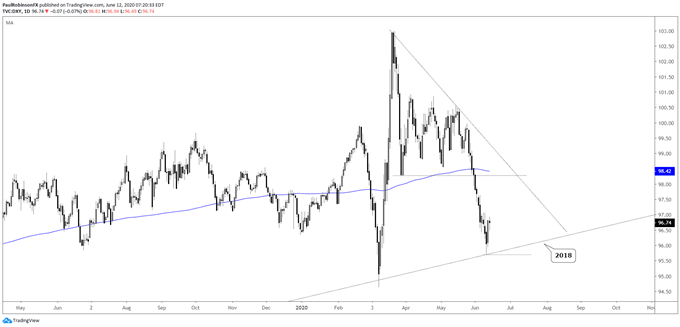
The US Dollar Index (DXY) shot higher yesterday as risk-off gripped risky assets amidst renewed uncertainty with the coronavirus and the economic outlook. The bounce is coming off a trend-line running higher since 2018, and if the momentum is any indication the bounce could quickly morph into a rally. Look for the 95.72 low to hold for more upside towards the 200-day MA and higher to develop. A break below the low and trend-line will put even more pressure on the Dollar, with DXY 94.65 eyed as the next level of support.


US Dollar Index (DXY) Daily Chart (coming off trend support)

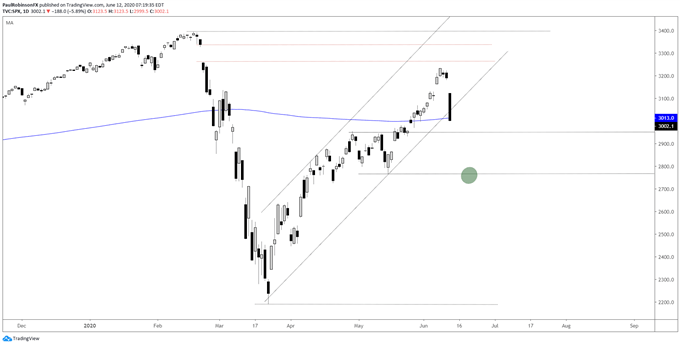
The S&P 500 got crushed yesterday. It was the type of turn after a rally that suggests that there is more from where that came from. The SPX closed the day below the 200-day and will begin today trading just above it; watch how this tug-of-war plays out. The thinking is we will see more weakness in the week ahead, with potential for a move to the May 14 low in the cards in the not-too-distant future. If the market can manage to stabilize and turn higher quickly, it is possible it was a one-off event, but that doesn’t look very likely at this time.
S&P 500 Daily Chart (sharp turn likely means more selling)

For all the charts we looked at, check out the video above…
Resources for Forex Traders
Whether you are a new or an experienced trader, DailyFX has several resources available to help you; indicator for tracking trader sentiment, quarterly trading forecasts, analytical and educational webinars held daily, and trading guides to help you improve trading performance.
---Written by Paul Robinson, Market Analyst
You can follow Paul on Twitter at @PaulRobinsonFX


