Crude Oil Outlook, S&P 500 Analysis – TALKING POINTS
- Dark clouds loom over S&P 500, crude oil after respective uptrends were broken
- Equity index outlook bearish after it failed to clear a key technical obstacle
- Brent may face heightened liquidation pressure as it heads towards support
S&P 500 Forecast
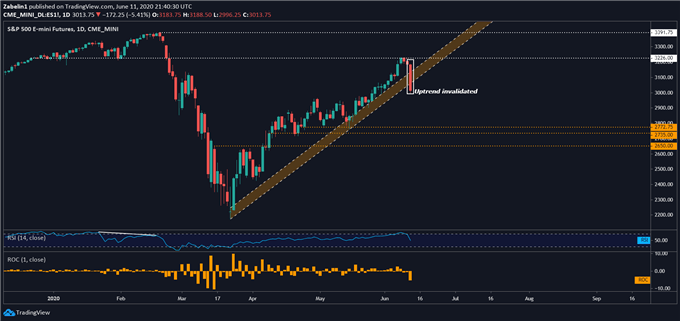
After rising over 20 percent since bottoming out in mid-March, the S&P 500 index may now be on the verge of a broader pullback after it failed to clear one of two major resistance levels .The rejection at 3226.00 not only led to the invalidation of a multi-month uptrend, but also signaled that investors do not feel confident in the index climbing above that particular threshold.


S&P 500 Index – Daily Chart

S&P 500 index chart created using TradingView
If selling pressure persists, the S&P 500 could end up falling over seven percent until the index hits support at 2772.75. If that too cracks under the weight of sellers, the next line of defense may be a holding point at 2735.00. Either way, the optics of failing to clear what appears to be a technically-significant level may cast a deep and dark shadow over the index’s near-term outlook.
Be sure to follow me on Twitter @ZabelinDimitri to get updates on key technical levels!
Crude Oil Technical Analysis
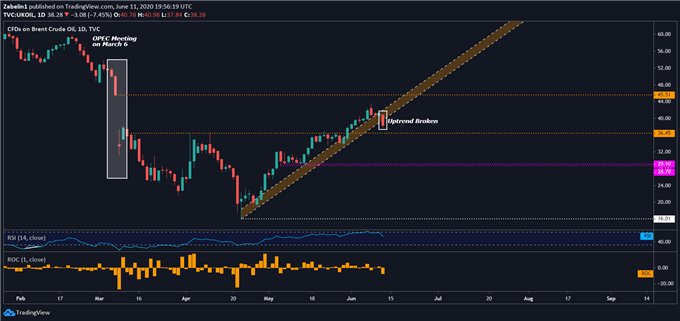
Crude oil prices closed over six percent lower on Thursday and broke below the mid-April uptrend that has helped the cycle-sensitive commodity climb over 100 percent after it cratered earlier that month. Brent is now at risk of retesting a familiar stalling point at 36.45, which if broken could inspire additional sellers to enter the market.


Crude Oil – Daily Chart

Crude oil chart created using TradingView
If support there is broken, bearish sentiment may start to swell and could push crude oil prices to retest a narrow but critical support range between 29.10 and 28.70. If Brent reaches this range, selling pressure could start abating. Having said that, a bounce back may not necessarily indicate an underlying confidence to climb higher but a hesitation to dip below a particular threshold.
--- Written by Dimitri Zabelin, Currency Analyst for DailyFX.com
To contact Dimitri, use the comments section below or @ZabelinDimitri Twitter


