


DAX 30, FTSE 100 & CAC 40 Price Outlook:
- The DAX 30 broke beneath an ascending trendline and Fibonacci support
- Similarly, the FTSE 100 pierced the lower bound of a rising channel that helped guide price higher
- Not to be outdone, the CAC 40 is moving quickly toward a possible area of tertiary support after breaking through various Fibonacci levels
DAX 30, FTSE 100 & CAC 40 Forecasts: How Far Will Stocks Fall?
European equities showed early signs of weakness this week as sellers took control to push them beneath their recent peaks. Up until Thursday, US indices had not displayed serious signs of weakness as traders awaited the Fed rate decision. With the event risk passed, the DAX 30, FTSE 100 and CAC 40 have been joined by their US counterparts and selling has picked up pace. With accommodative central banks and governments behind them, the catalyst behind the recent retracement in developed equities is unclear, so how far will stocks fall?
Unfortunately for us as traders, it is exceedingly difficult to say. Without a clear driver, it can be argued a mere shift in sentiment is responsible for the current price action. Whatever the case may be, many analysts have long warned the fundamental conditions have become detached from current equity valuations – particularly in the United States. That being said, one of the most encouraging drivers of the most recent leg higher has been the technical landscape in my opinion.
DAX 30 Price Chart: 4 – Hour Time Frame (February – June)

As I stressed in my equity webinar, the consistent series of higher-highs and higher-lows across the major equity markets was a largely bullish sign. Although the fundamental drivers in the selloff are somewhat opaque, perhaps the most concerning development at this time is the damage dealt to the different technical formations.

In the case of the DAX 30, bearish price action pierced an ascending trendline and Fibonacci support around 12,447. This has opened the door to further losses, and the German equity index can now look to attack subsequent Fibonacci support around 11,592. A break beneath this area would constitute a new swing low and could increase selling pressure further.
FTSE 100 Price Chart: 4 – Hour Time Frame (March – June)
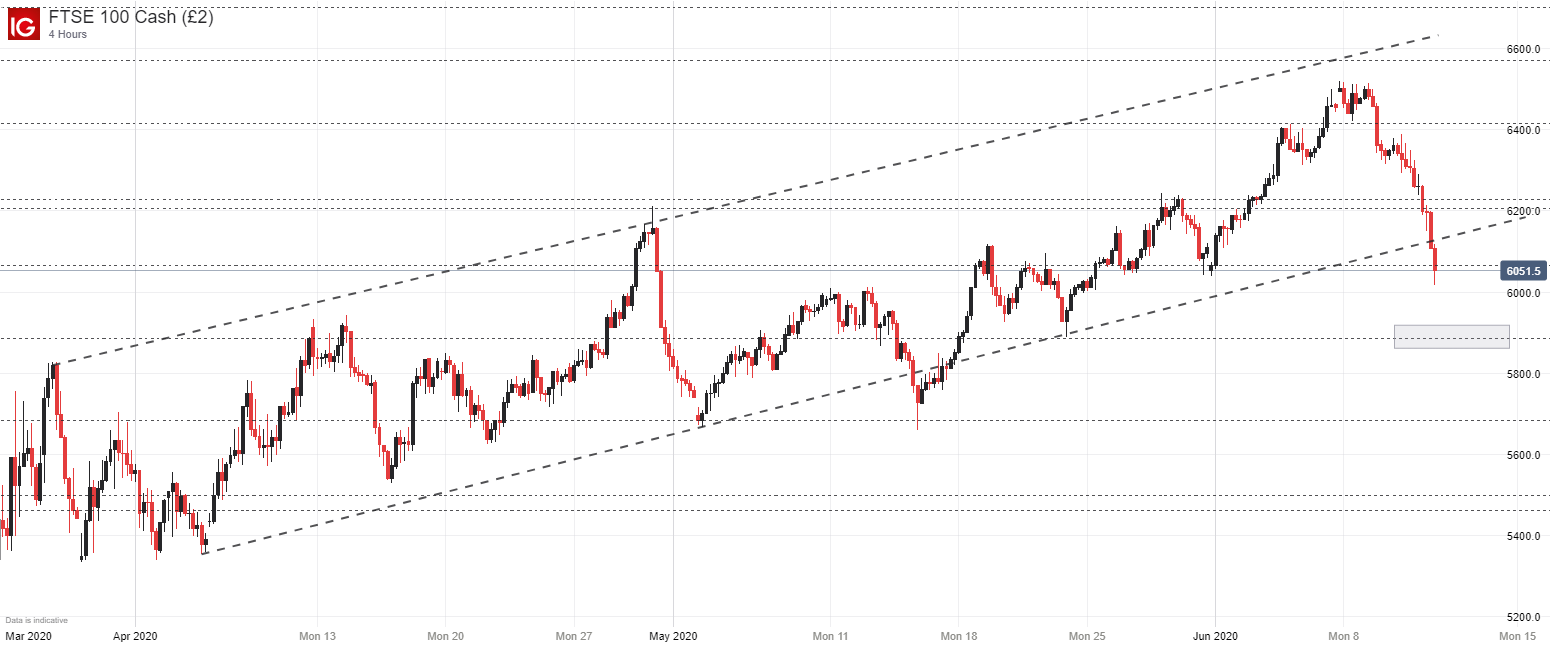
Shifting focus to the FTSE 100, the destruction of an ascending channel from early April amounts to a major technical blow for the index. With the lower-bound broken and with secondary support around 6,067 pierced, technical traders may look for tertiary support around 5,885 which coincides with the bottom of a minor pullback in May.
CAC 40 Price Chart: 4 – Hour Time Frame (February – June)

A similar story is developing on the CAC 40. Selling pressure has moved the index from its recent peak and support has been tested. As it stands, the Fibonacci level around 4,672 may be the next level at risk.In the meantime, follow @PeterHanksFX on Twitter for updates.

Altogether, it seems the most concerning development from the recent price action is the irreversible damage dealt to the technical patterns that had been guiding price action higher over recent weeks. Thus, even if selling stalls out and bulls rejoin the fray, traders will have to negotiate these levels on a rebound higher which effectively makes any eventual recovery attempt more arduous.
--Written by Peter Hanks, Analyst for DailyFX.com
Contact and follow Peter on Twitter @PeterHanksFX


