


ASX 200, Australia, OECD Talking Points:
- OECD suggests extension of fiscal stimulus packages “beyond their September expiry date”
- ASX200 fails to breach ‘golden ratio’ resistance as technical indicators suggest rally may be running out of steam.
- Weekly analysis reinforces the bearish tilt seen on the lower time frames.
The return of Australian consumer confidence to pre-crisis levels was unable to fuel the ASX 200’s rally to fresh-monthly highs as it followed its US counterparts lower overnight.
Investors may be spooked by the Organization for Economic Cooperation and Development (OECD) bi-yearly report suggesting an extension of the fiscal support measures provide by the Australian government “beyond their September expiry date” to continue to support the local economy.
Considering the “JobKeeper wage subsidy is equivalent to over 3.5% of GDP,” the rapid return of economic production to pre-crisis levels could be paramount ahead of the September 27 deadline in order to sustain the ASX 200’s rally.
ASX 200 Price Daily Chart

Source – Trading View
The 61.8% Fibonacci (6,124), aka ‘the golden ratio’, continues to prove a formidable challenge for the ASX 200 as it attempts to clear former support-turned-resistance at the 2009 uptrend.
A Shooting Star candle on June 9 may invigorate sellers and drive price back to the uptrend extending from the March low (4,387), as buyers were unable to sustain a push above the 200-day moving average (6,094).
The reaction of RSI suggests a bearish bias, as the oscillator fails to burst into overbought territory and begins to fade towards three-month trend support.
Momentum is stagnating at its highest levels since the ASX pushed to April highs (5,590). This may reinforce the bearish bias displayed by price action and RSI, possibly resulting in a more aggressive correction towards a key region of interest at the 50% Fibonacci (5,792) and the monthly low (5,682).
Failure to hold support at the June low (5,682) could lead to a resumption of the primary downtrend, with a daily close through trend support carving a path back to the April high (5,590) and the 38.2% Fibonacci retracement (5,461) of the yearly decline.

ASX 200 Price Weekly Chart
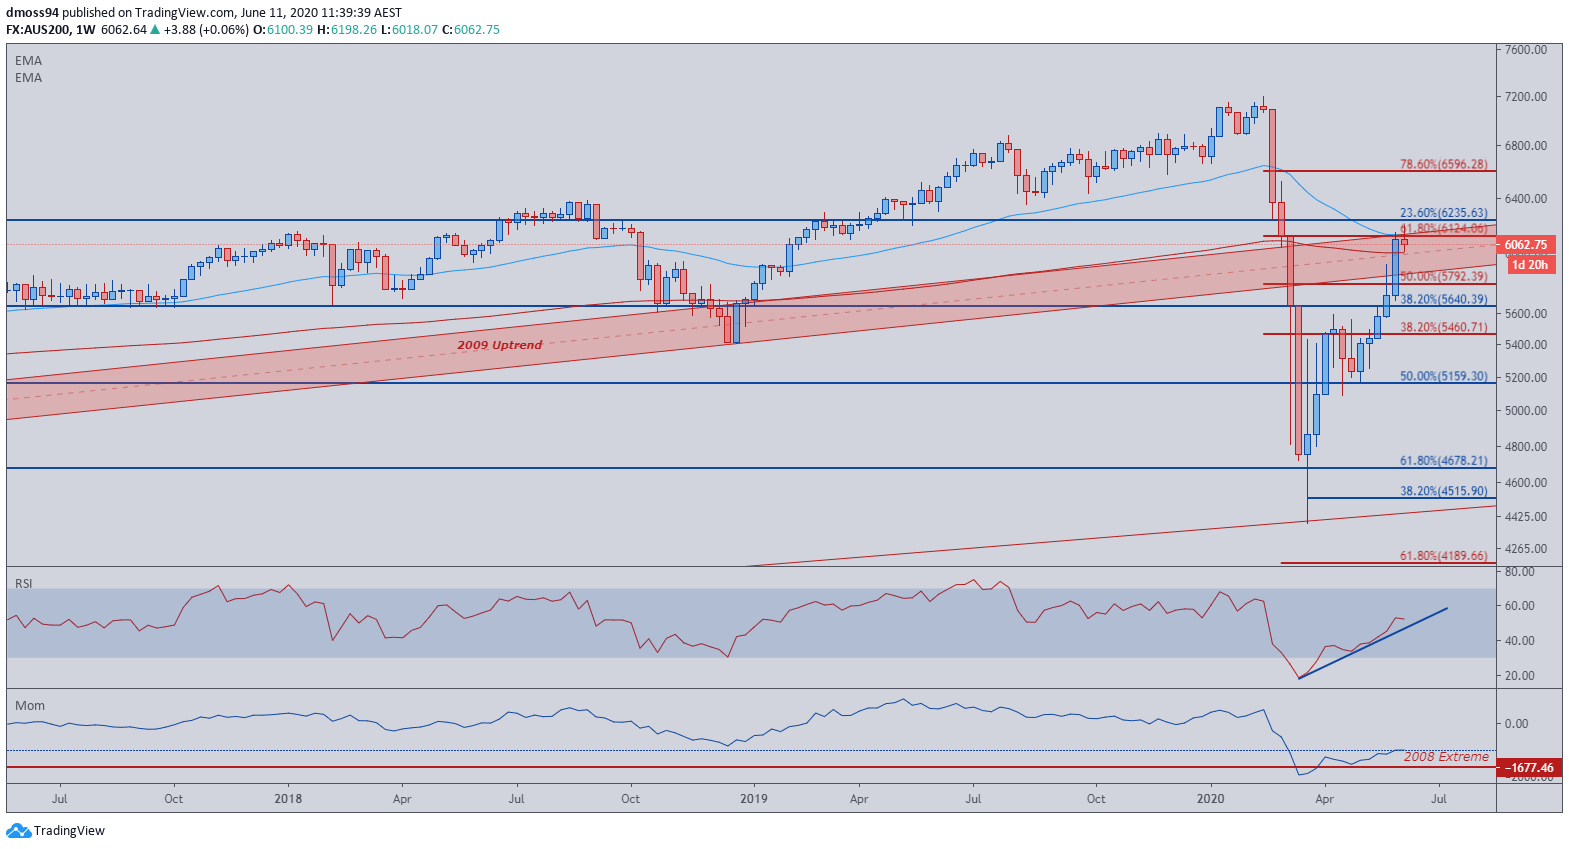
Source – Trading View
Zooming out to a weekly chart and the premature formation of a bearish Shooting Star candle seems to support the bearish bias seen on the lower time frames.
Convergence of the 50-week moving average and 61.8% Fibonacci (6,124) has capped topside potential thus far, with a weekly close below the 200-MA (6,008) possibly leading to a reversal of the 12-week rally from the March low (4,387).
Once again, RSI may prove to be an early indication of future direction, as it fades prior to the bullish region above 60.
RSI snapping its constructive trend may reinvigorate sellers and carve a path for price to retest support at the 38.2% Fibonacci retracement of the 2009 bull market (5,640), with a more aggressive decline possibly carving a path back to the May low (5,166).
-- Written by Daniel Moss
Follow me on Twitter @DanielGMoss


