


Bitcoin Analysis, S&P 500 Index, BTC/USD – TALKING POINTS
- BTC/USD briefly touched key 10,000 marker and then subsequently retreated
- Bitcoin uptrend may be at risk as pair shies away from resistance at 10540.49
- S&P 500 slope of appreciation at risk as equity index stalls at a familiar level
Bitcoin Analysis: Will BTC Fall With Equity Markets?
Since bottoming out at a 12-month low, Bitcoin has risen over 100 percent and has been carried higher by a modestly-stable uptrend – at least when compared to the S&P 500, but more on that later. The pair recently crossed the highly-watched 10,000 checkpoint, though BTC/USD subsequently retreated and has been trading sideways ever since.
BTC/USD – Daily Chart

BTC/USD chart created using TradingView

However, looking at a weekly chart shows that Bitcoin is approaching a critical price juncture where the integrity of the uptrend may be tested as BTC/USD comes up against resistance at 10168.35. Failure to clear that obstacle and the tier above it at 10540.49 could lead to BTC/USD invalidating the slope of appreciation. That break could mark a shift in the pair’s short-term trajectory and lead to a broader pullback.
BTC/USD – Weekly Chart
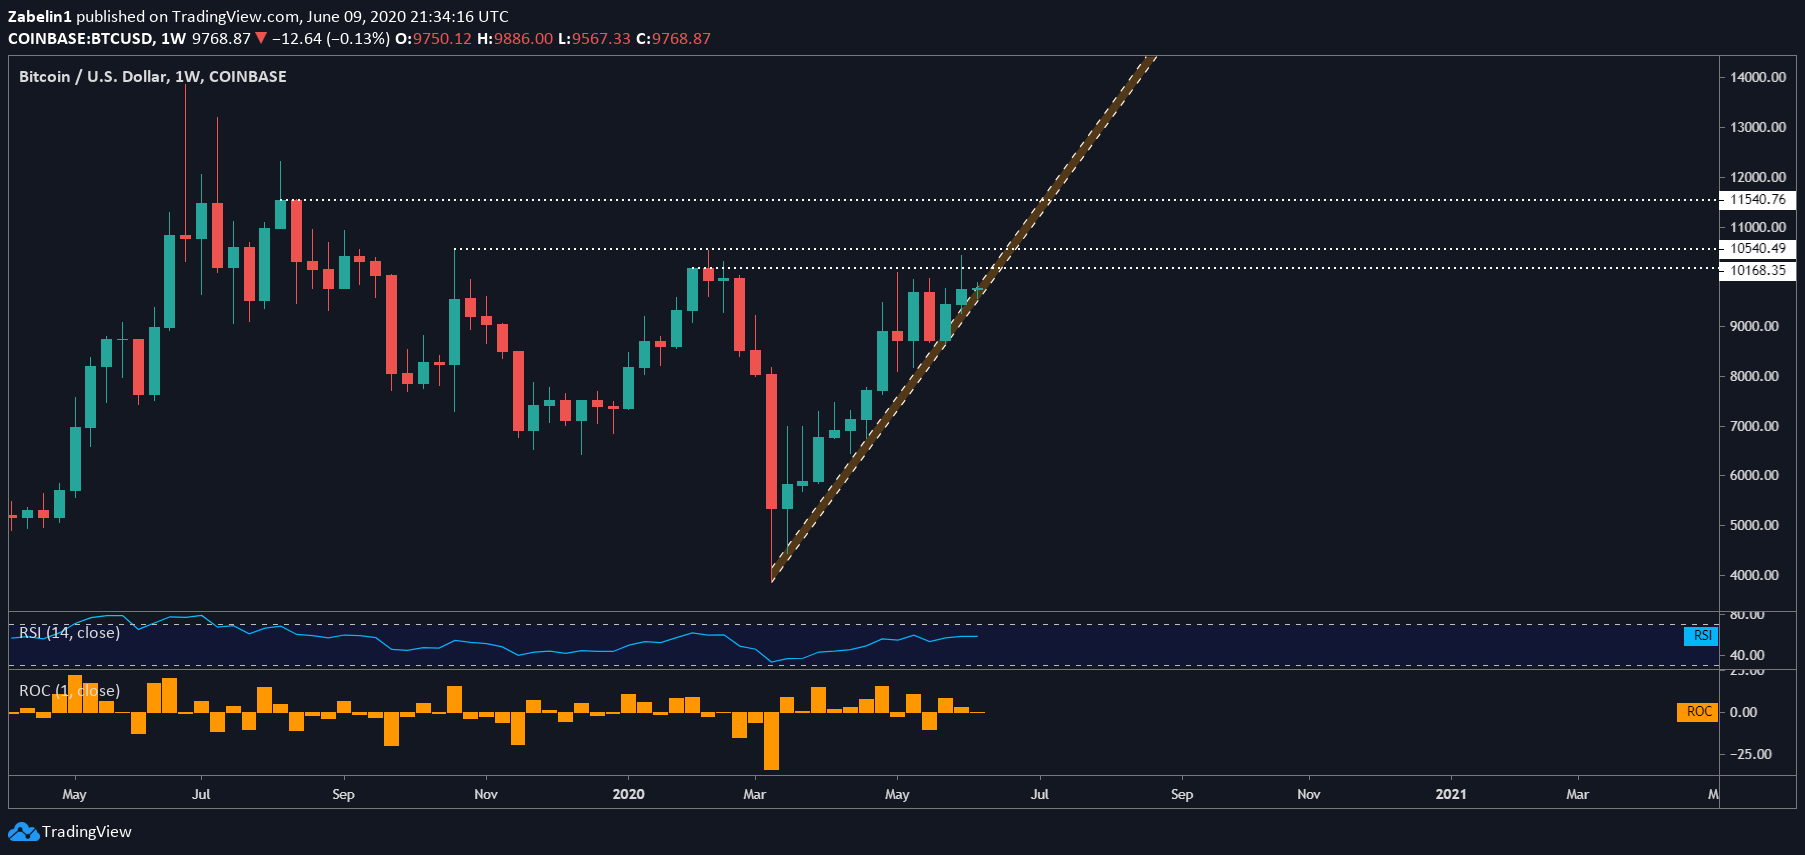
BTC/USD chart created using TradingView
Bitcoin may also fall not only because of a possible loss in risk appetite, but a stronger US Dollar could weaken the BTC/USD exchange rate. While the US Dollar index (DXY) is at an 11-week low, a comeback could be in the cards. If investors’ priorities shift from holding a relatively higher-risk asset like BTC to a more liquid and stable one like the Greenback, BTC/USD may end up facing heightened liquidation pressure.

S&P 500: Will Stocks Drop?
The multi-trillion dollar question on everyone’s mind is will the S&P 500 retest its pre-selloff high? The simple answer is: no one knows. However, recent price action shows that the benchmark equity index is experiencing friction at a familiar stalling point going all the way back to early January at 3226.00. Failure to clear it will mean retesting the durability of the uptrend that brought it to its current level.
S&P 500 Index Futures – Daily Chart
S&P 500 Index Futures chart created using TradingView
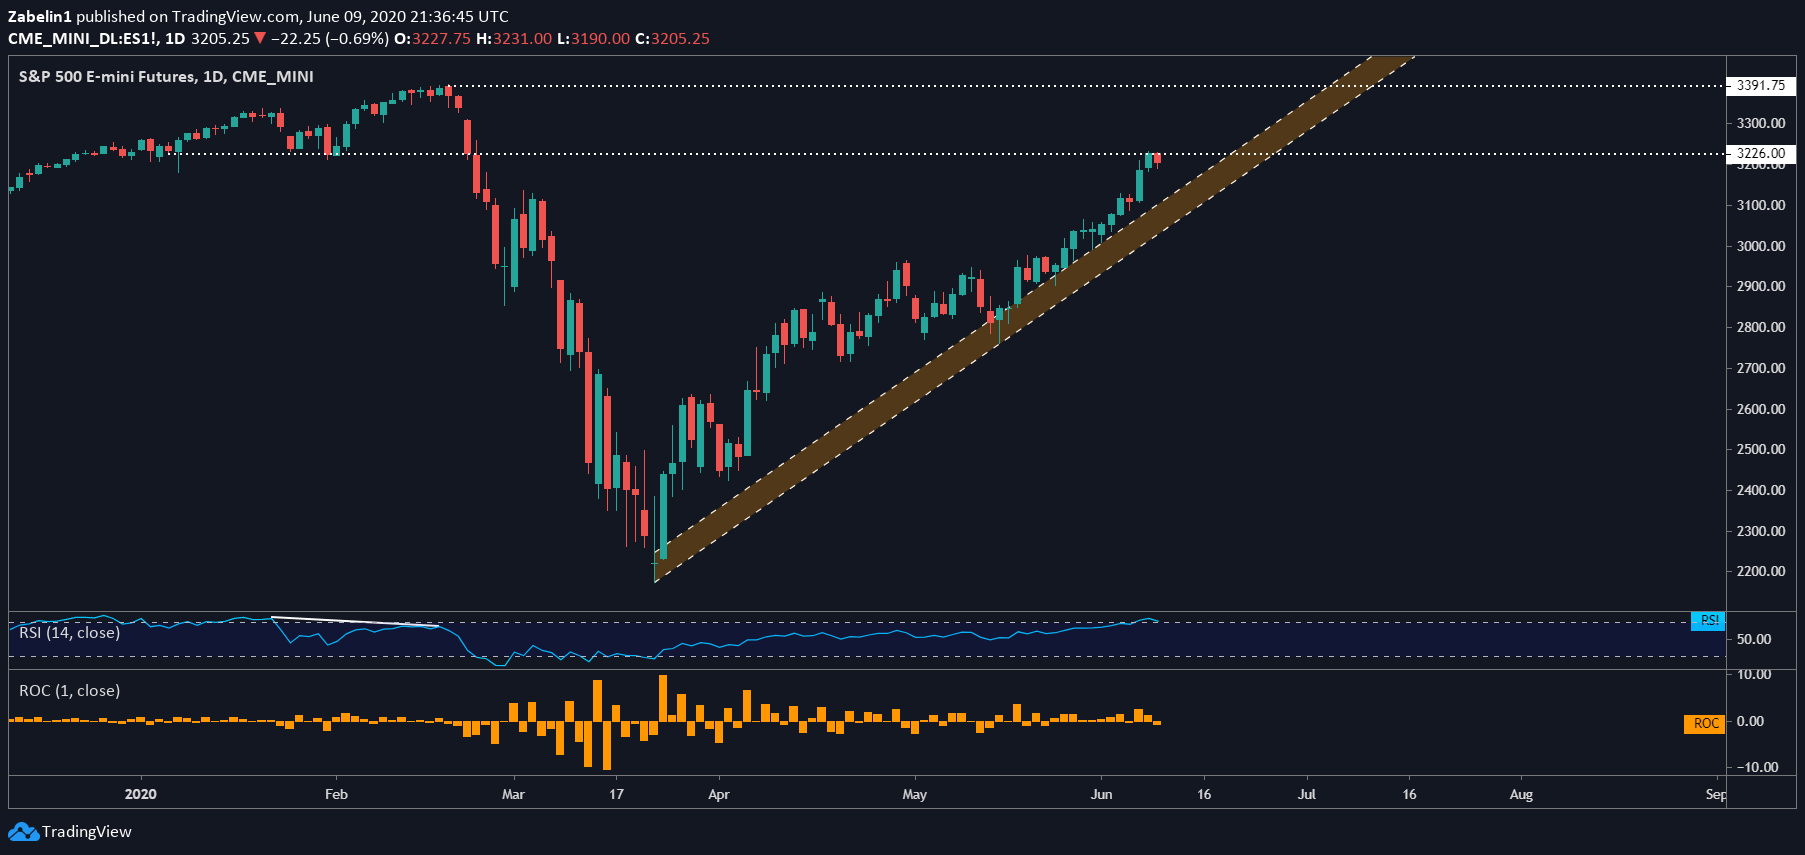
Using a weekly chart shows how spectacular the S&P 500’s almost-90 degree recovery has been, but the 3226.00 stalling point on this wider timeframe appears also to be technically significant. Clearing it could open the door to retesting the swing-high at 3391.75. However, if the ceiling at 3226.00 holds and the uptrend cracks, a broader pullback may ensue.
S&P 500 Index Futures – Weekly Chart

S&P 500 Index Futures chart created using TradingView
--- Written by Dimitri Zabelin, Currency Analyst for DailyFX.com
To contact Dimitri, use the comments section below or @ZabelinDimitri Twitter


