GBP price, news and analysis:
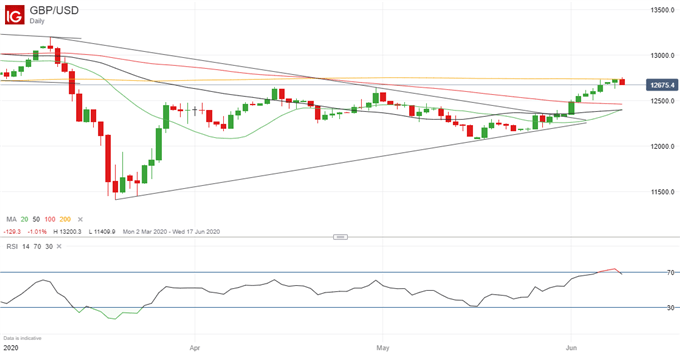
- The recent advance in GBP/USD has come to a halt near-term as it struggles to break above resistance at the 200-day moving average.
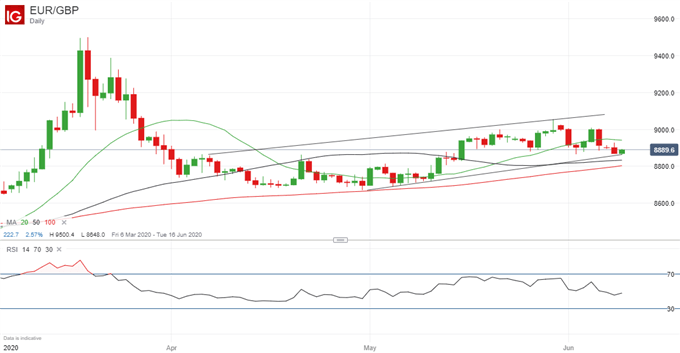
- Similarly, the recent decline in EUR/GBP has halted at support from an upward-sloping trendline in place since the start of May.
- UK retail sales data show a smaller drop in annual sales in May.
GBP/USD rate loses momentum
The recent advance in GBP/USD has ground to a halt at the 200-day moving average. However, it is too early to say whether it will break through to record further gains or start to slip back.
GBP/USD Price Chart, Daily Timeframe (March 2 – June 9, 2020)

Chart by IG (You can click on it for a larger image)
Similarly, Sterling’s recent strength against the Euro has paused, with EUR/GBP’s decline halting at support from a trendline joining the recent higher lows that has been in place since May 1. The FTSE 100 index of leading London-listed stocks is failing to advance too, dropping by around 0.4% in early business.
EUR/GBP Price Chart, Daily Timeframe (March 6 – June 9, 2020)

Chart by IG (You can click on it for a larger image)
| Change in | Longs | Shorts | OI |
| Daily | 8% | -8% | 1% |
| Weekly | -14% | 38% | 1% |
UK retail sales drop less in May than in April
Turning to the fundamentals, the British Retail Consortium reported early Tuesday that annual sales fell by 5.9% last month, although it was a better performance than April, when sales tumbled by a record 19.1%.
Learn how to master the forex spread and keep your trading costs low with our strategies and tips
We look at currencies regularly in the DailyFX Trading Global Markets Decoded podcasts that you can find here on Apple or wherever you go for your podcasts
--- Written by Martin Essex, Analyst and Editor
Feel free to contact me via the comments section below


