


Natural Gas, LNG, Talking Points
- The COVID-19 outbreak has resulted in a historic decline in demand for natural gas
- With storage facilities fast running out of room, LNG may continue to slide toward historic lows.
Seasonal factors, oversupply issues and the outbreak of COVID-19 has seen the price of liquefied natural gas (LNG) fall to 22-year lows (1.519), with the situation exacerbated by ‘fuller-than-normal’ storage facilities.
According to Rystad Energy, global LNG supply is projected to rise to 380 million tonnes in 2020 compared to demand for 359 million tonnes, with the data provided by the independent energy research and business intelligence company pointing to an oversupply issues prior to the outbreak of COVID-19.
At the same time, the introduction of renewable energies along with the milder European winters of the last two years have resulted in storage facilities that are greater than 60% full, and preliminary forecasts predict they will be at capacity by the end of July.
Historic levels of U.S shale production fuelled the oversupply seen in the gas market, but the recent collapse in the price of oil has had a drastic effect on the industry resulting in the decommission of 107 natural gas rotary rigs in the last 12 months.
This blow dealt to the U.S shale industry may help to temporarily support prices although the overwhelming lack of demand is likely to be a major headwind and may lead to an extended period of depressed gas prices.
Natural Gas Daily Price Chart
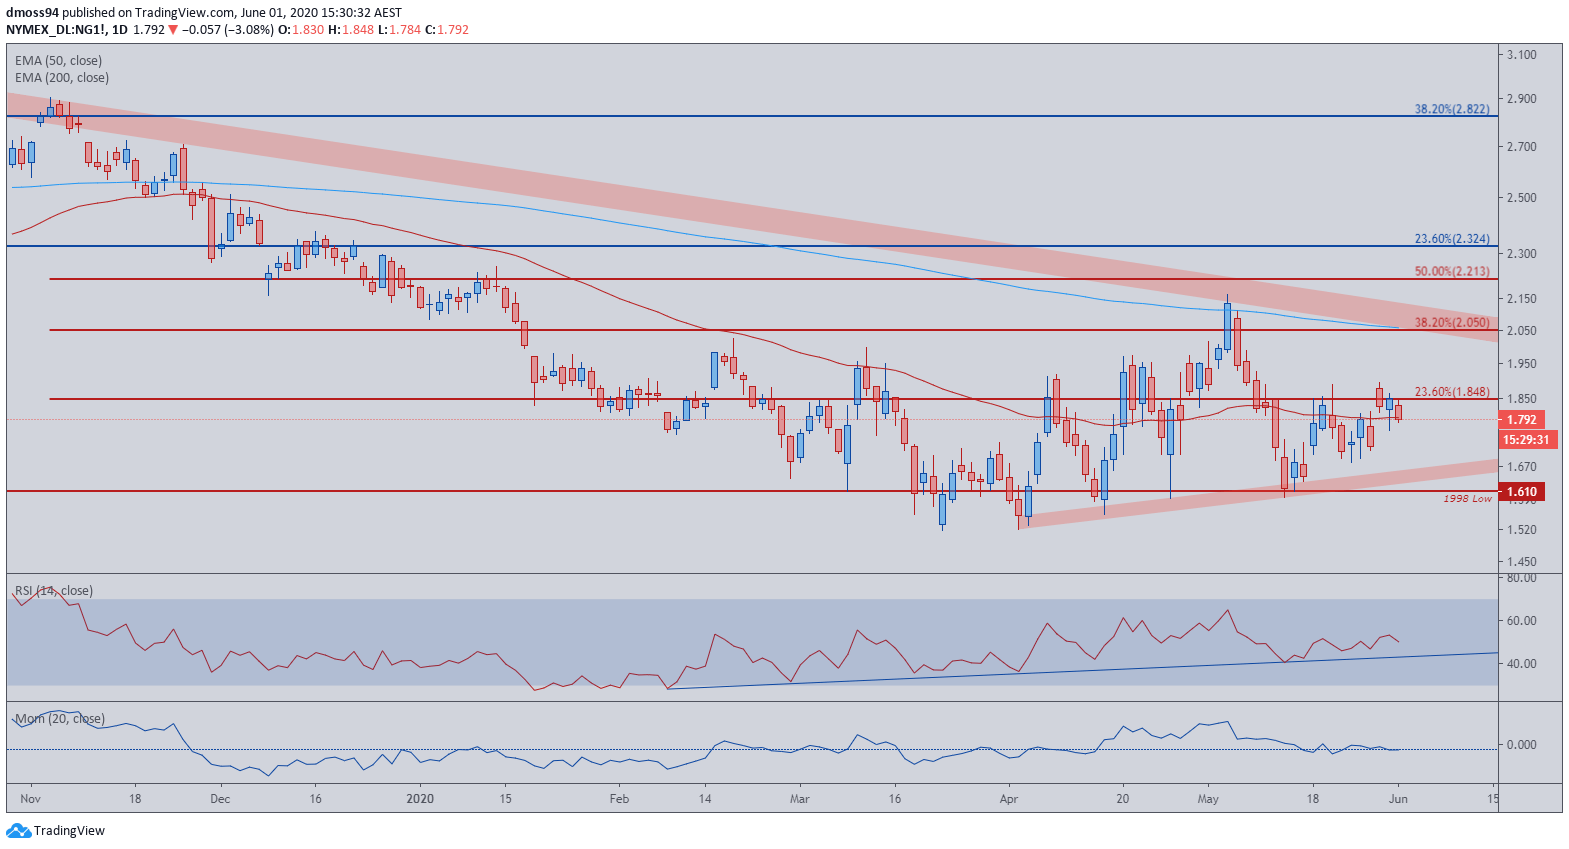
Source: TradingView
After falling to 22-year lows on the 23rd of March (1.519), the price of natural gas climbed 42% to test resistance at the 200-day moving average (MA) and an 18-month downtrend (2.162) extending from the 2018-high.
Inability to close above the 200-MA resulted in price collapsing back to the 1998-low (1.61) before rallying to test the 23.6% Fibonacci retracement of the yearly decline (1.848). Failure of price to close convincingly above the 23.6% Fibonacci level (1.848) may clear a path to re-test the yearly low (1.519), should trend support fail to hold.
--- Written by Daniel Moss
Follow me on Twitter @DanielGMoss


