Gold Price (XAU/USD) Analysis, Price and Chart
- Gold gaining a small safe-haven bid as US-China tensions increase.
- China moves to impose national security laws on Hong Kong.


Gold Underpinned as US-China Political Tensions Grow
As political tensions between the US and China increase, gold is picking up a safe-haven bid ahead of the long weekend and may look to press higher. This week, the US continued to discuss barring Chinese companies from listing on US stock markets, cutting off an important flow of capital, while US President Donald Trump continued to warn China that the US would impose additional tariffs on the country in response to perceived Chinese inactions over the COVID-19 virus outbreak.
The Hong Kong stock market fell sharply overnight after China proposed a new security law in Hong Kong that would override parts of Hong Kong law. There are fears that China will now over rule elected Hong Kong officials and impose their new security laws. The Hang Seng finished the session 5.6% lower, its largest fall since 2015.
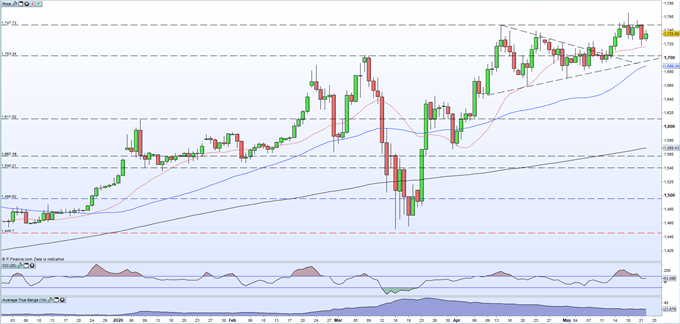
With the risk being shunned, gold has edged higher and continues to consolidate its recent push higher. The precious metal hit a seven-year high of $1,766/oz. at the start of the week after breaking out of a bullish pennant formation last week. The CCI indicator has moved back from being extremely overbought on this week’s fade lower, while short-term support from the 20-dma ($1,716/oz.) remains in place. Recent highs between $1,748/oz. and $1,755/oz. will act as resistance ahead of the May 18 multi-year high.
Gold Daily Price Chart (December 2019 – May 22, 2020)


What is your view on Gold – are you bullish or bearish?? You can let us know via the form at the end of this piece or you can contact the author via Twitter @nickcawley1.


