


Dow Jones & US Dollar Analysis and News
- RORO Flows Drives Short Term Price Action
- Eyes on China Tensions as Market Optimism Remains
RORO Flows Drives Short Term Price Action
Short term flows across the currency space have been dominated by RORO (Risk On/Risk Off) as FX correlations with equity markets rise sharply. US equity futures have seen a sharp rebound from the March lows with the S&P 500 within close vicinity to the 3000 level, while the Dow Jones is around the post-crash highs. That said, we believe RORO has been among the key factors behind the pullback in the US Dollar throughout the past week with the chart below highlighting an increasingly negative correlation between the USD and Dow Jones.

Figure 1. 30-Day Correlation Log Between US Dollar and Dow Jones
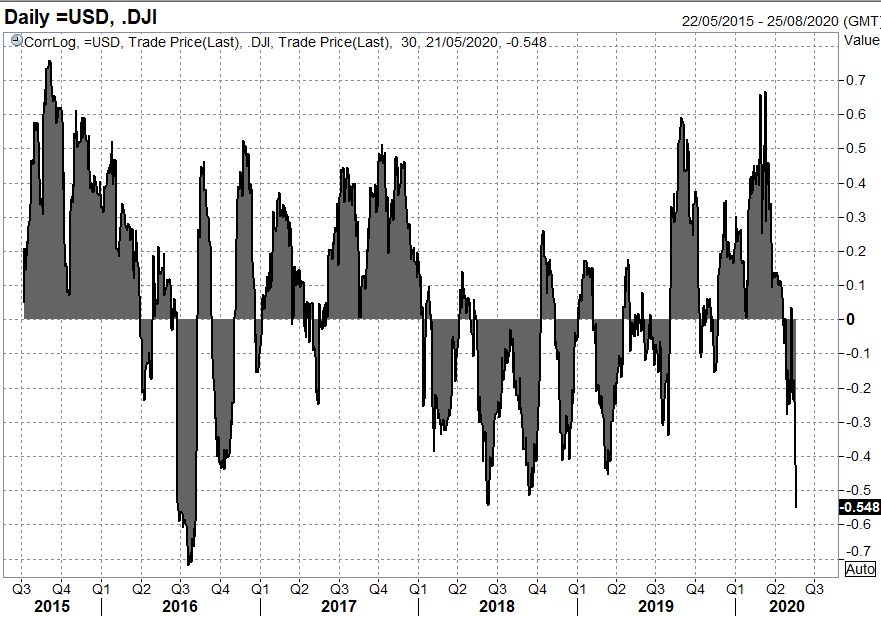
Source: DailyFX, Refinitiv
Eyes on China Tensions as Market Optimism Remains
Vaccine hopes, a Franco-German recovery package proposal, and a Fed that is committed to provide further liquidity has taken some of the shine off the safe-haven US Dollar. However, cracks in market optimism are beginning to emerge with tensions between the US and China on the rise. Yesterday, the Senate overwhelmingly voted in favour of a bill that would place Chinese companies listed in the US under greater scrutiny, which in turn raises the likelihood that we will see a retaliation from China (Focus on USD/CNH for Escalating Trade Tension Signal).
Elsewhere, while the Franco-German aid proposal marks a significant step forward, concerns arise with the fact that it needs to be unanimously voted in favour of, which is where lies the issue as fiscal hawks, such as the Netherlands and Austria will need to be on board. A tough ask if changes are not made. With this in mind, given that a lot of positive news is seemingly priced in, market disappointment regarding emerging uncertainties (notably US/China tensions) could see a short-term bottom in the US Dollar (99.00 remains key to hold recent range), coinciding with a possible top across equity markets.
| Change in | Longs | Shorts | OI |
| Daily | -14% | 1% | -6% |
| Weekly | -8% | 1% | -3% |
Dow Jones Price Chart: Daily Time Frame
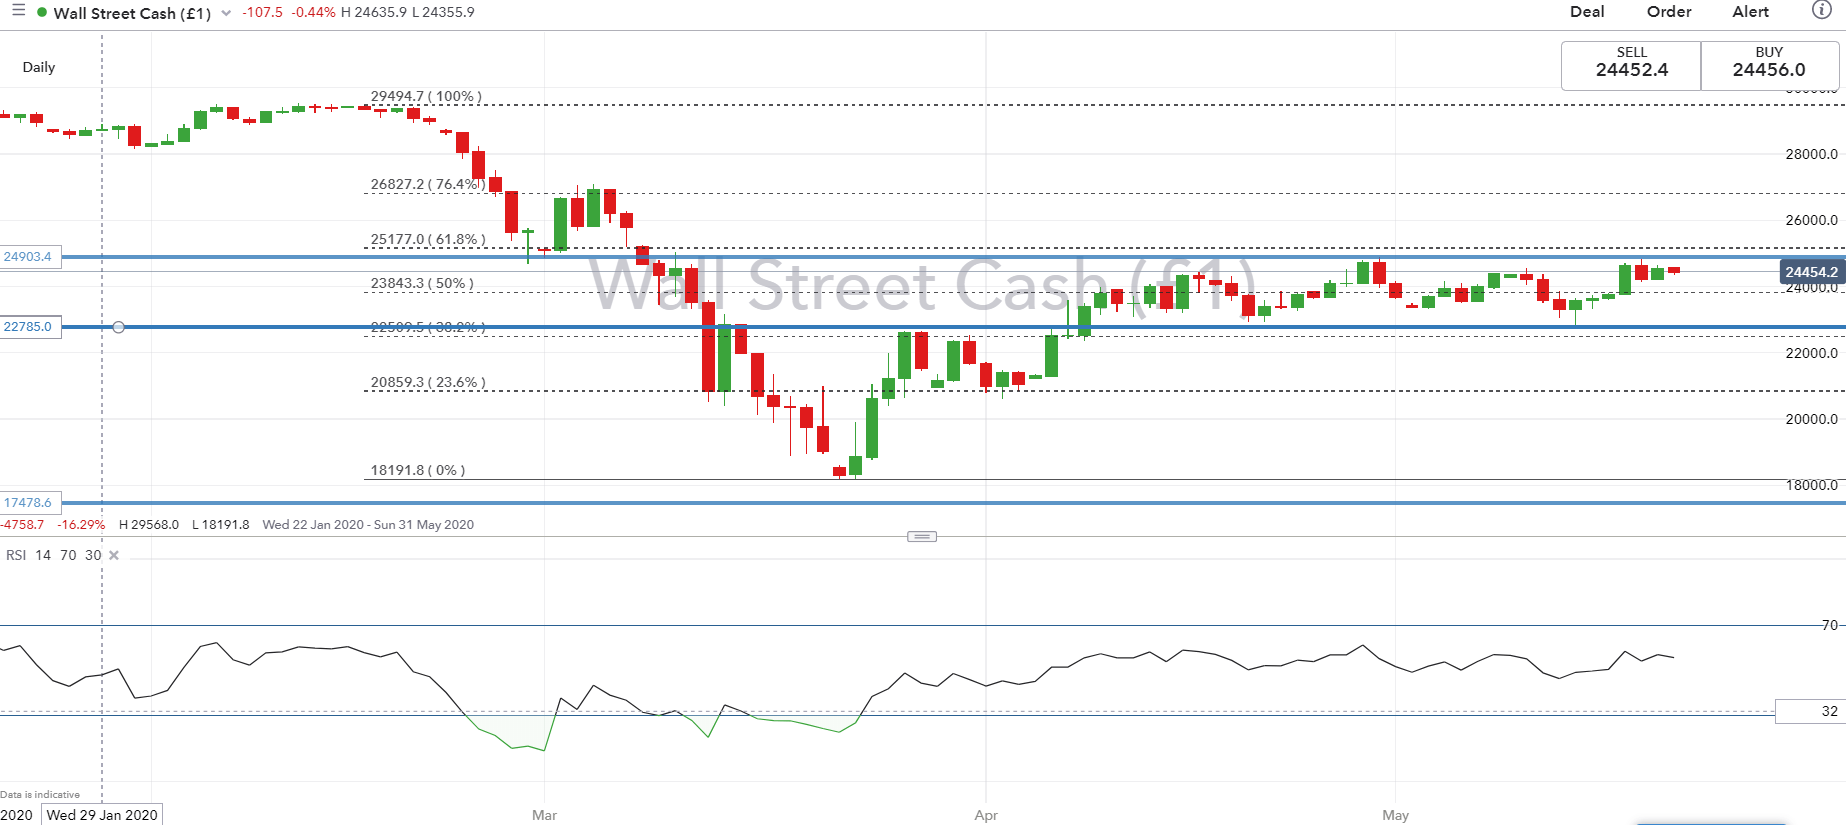
Source: DailyFX
US Dollar Price Chart: Daily Time Frame
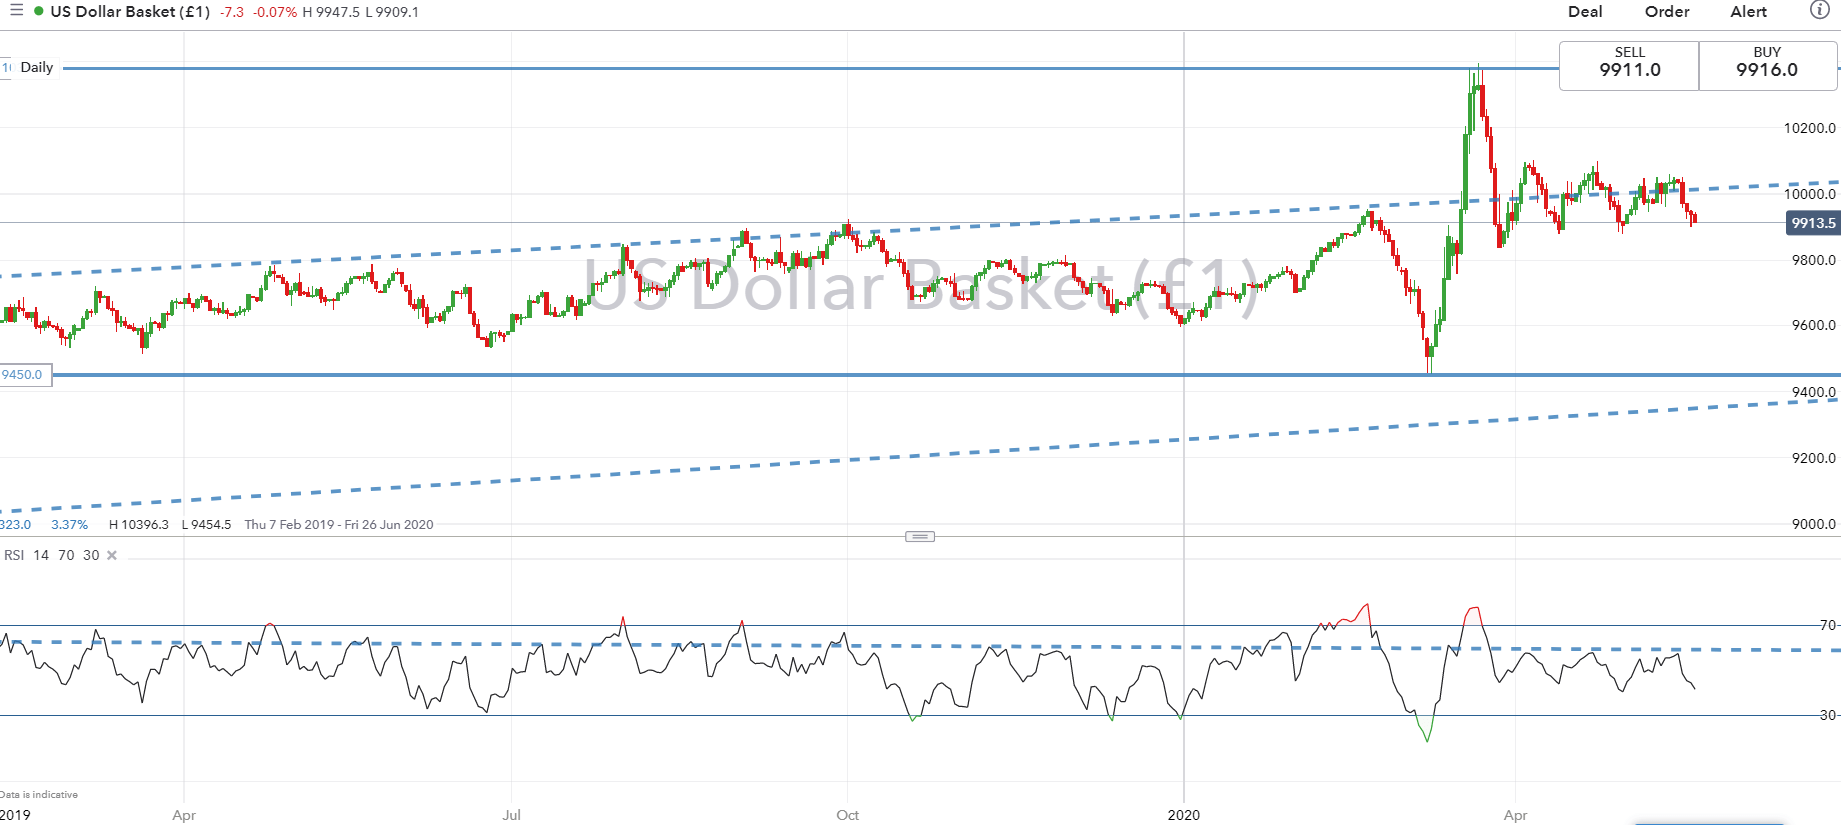
Source: DailyFX
--- Written by Justin McQueen, Market Analyst
Follow Justin on Twitter @JMcQueenFX


