


US Dollar vs. Mexican Peso (USD/MXN) Price, Analysis and Chart:

USD/MXN – Downtrend Remains in Charge
The Mexican Peso continues to benefit from the strong oil complex rebound off the April 6 spike low and USD/MXN keeps on with its slow grind lower. The US dollar is also moving lower, as the Fed’s money printer continues to work overtime, and any potential rebound looks set to be capped around the 101 area. Later today, the FOMC minutes will give the market a clearer picture about the health of the US economy, although given Fed Chair Powell’s testimony to Congress yesterday, most of the outlook is probably already priced in the US dollar.
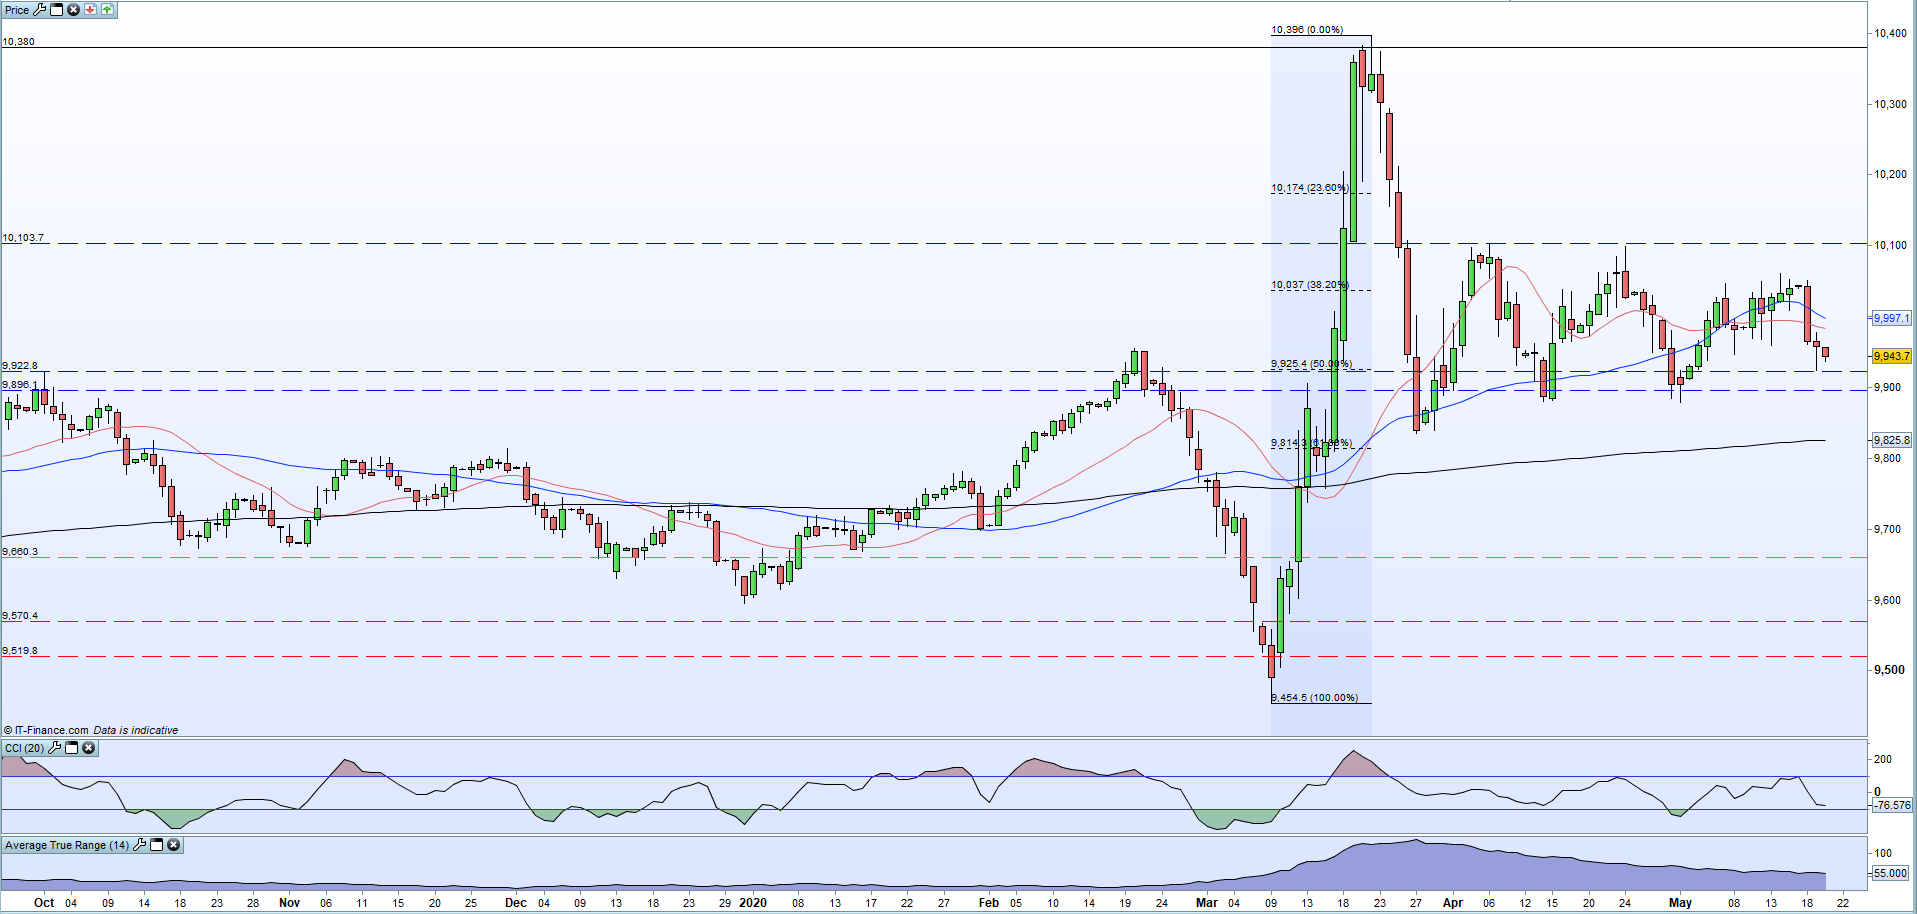
US Dollar Basket (DXY) Daily Price Chart (October 2019 – May 20, 2020)
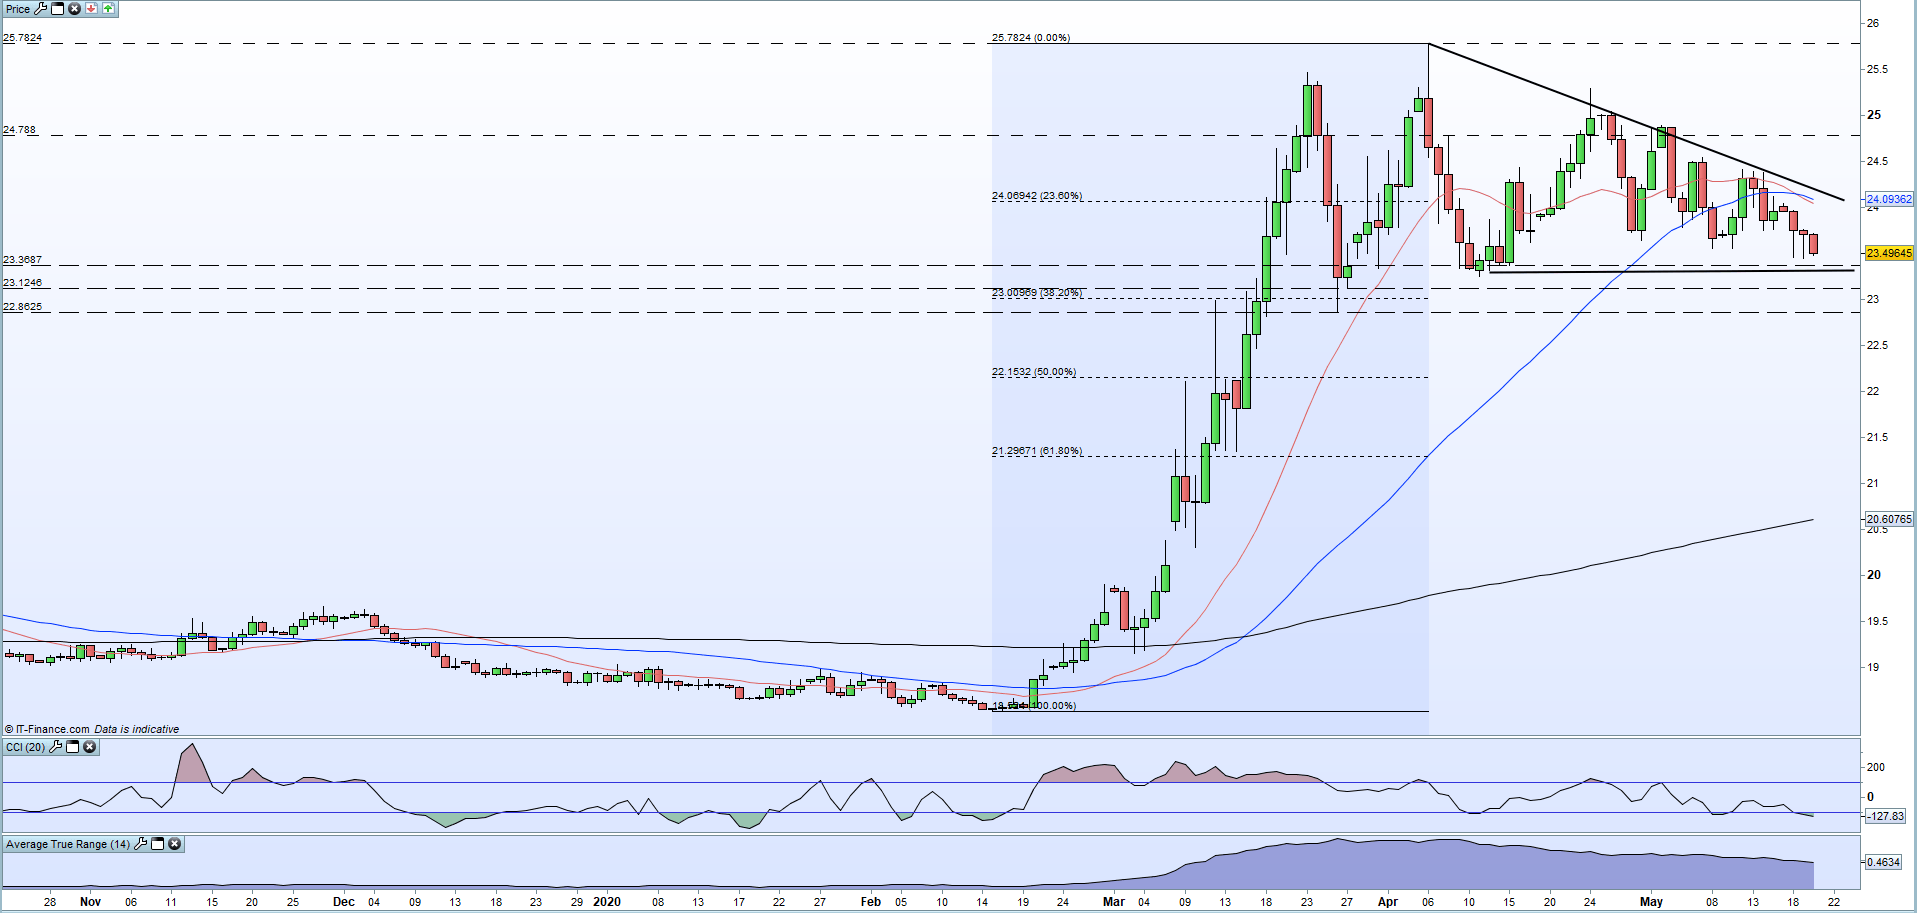
The recent downtrend continues to dominate price action and the pair are now closing in on multi-week support as a series of lower highs remain in place. The recent shift in sentiment is highlighted by the 20-dma (red line) now falling through the 50-dma (blue line) and if horizontal support off the April 13 reversal candle low is broken and closed below the 38.2% Fib retracement and big figure support at 23.00 guard the March 26 swing low at 22.8625. Below here support levels are harder to identify, due to the volatile price-action seen in some of the bullish candles from March onwards, but a 50% retracement of the late-February/early-April rally cuts across at 22.153.
If you are interested in technical analysis, see our updated Education Centre for a comprehensive range of indicators and analytical articles.
USD/MXN Daily Price Chart (October 2019 – May 6, 2020)

Traders may be interested in two of our trading guides – Traits of Successful Traders and Top Trading Lessons – while technical analysts are likely to be interested in our latest Elliott Wave Guide.
What is your view on USD/MXN – bullish or bearish?? You can let us know via the form at the end of this piece or you can contact the author via Twitter @nickcawley1.


