US Dollar (DXY) Price, Chart and Analysis.
- US retail sales for April may be the worst reading in decades.
- US dollar remains supported by upside price action is waning.


US Dollar Treads Water Ahead of US Retail Sales Report
The release of the April retail sales report today at 13:30 BST will show the true economic impact of the coronavirus shutdown in the US and the market is expecting a double-digit negative figure. The March figure slumped to a record low of -8.7% and today’s figure is expected to be in the region of -12%, and potentially higher, after the US unemployment rate soared to nearly 15% in April. In addition to the consumer spending report, the April industrial production data and the Michigan Consumer Sentiment report for May will be closely watched by US dollar traders.
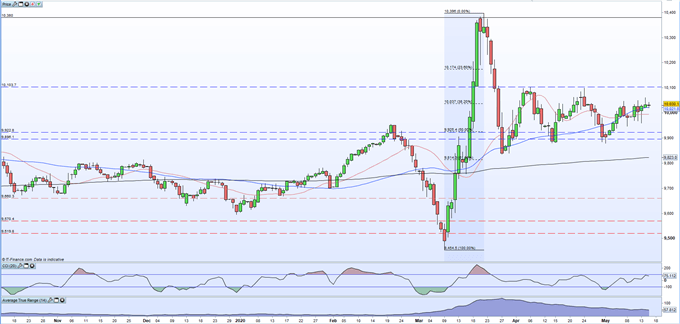
The US dollar basket (DXY) continues to trade in a sideways pattern set up over the last six weeks and is struggling for direction. The rally seen in May from the 98.80 low is intact but momentum is slipping while resistance around the 101.00 area is likely to hold. The 20-dma fell through the 50-dma at the end of last week, indicating that short-term upward momentum is slowing, while the CCI shows the US dollar is touching overbought levels last seen three weeks ago.
US Dollar (DXY) Daily Price Chart (2019 – May 15, 2020)


Traders may be interested in two of our trading guides – Traits of Successful Traders and Top Trading Lessons – while technical analysts are likely to be interested in our latest Elliott Wave Guide.
What is your view on the US Dollar – bullish or bearish?? You can let us know via the form at the end of this piece or via Twitter @nickcawley1.


