


FTSE 100 Price Analysis & News
- US-China Tensions on the Rise
- S&P 500 Risks Breaking Down
The tensions between the US and China are growing louder as China looks to impose countermeasures on US individuals who are filing lawsuits seeking COVID-19 damages from China. While President Trump has stated that he not only disappointed with China but will also place Chinese companies trading on US exchanges under scrutiny, it feels we are only one headline (or Tweet from President Trump) away from a notable escalation, which would be expected to place further pressure on risk assets.

S&P 500 Technical Levels
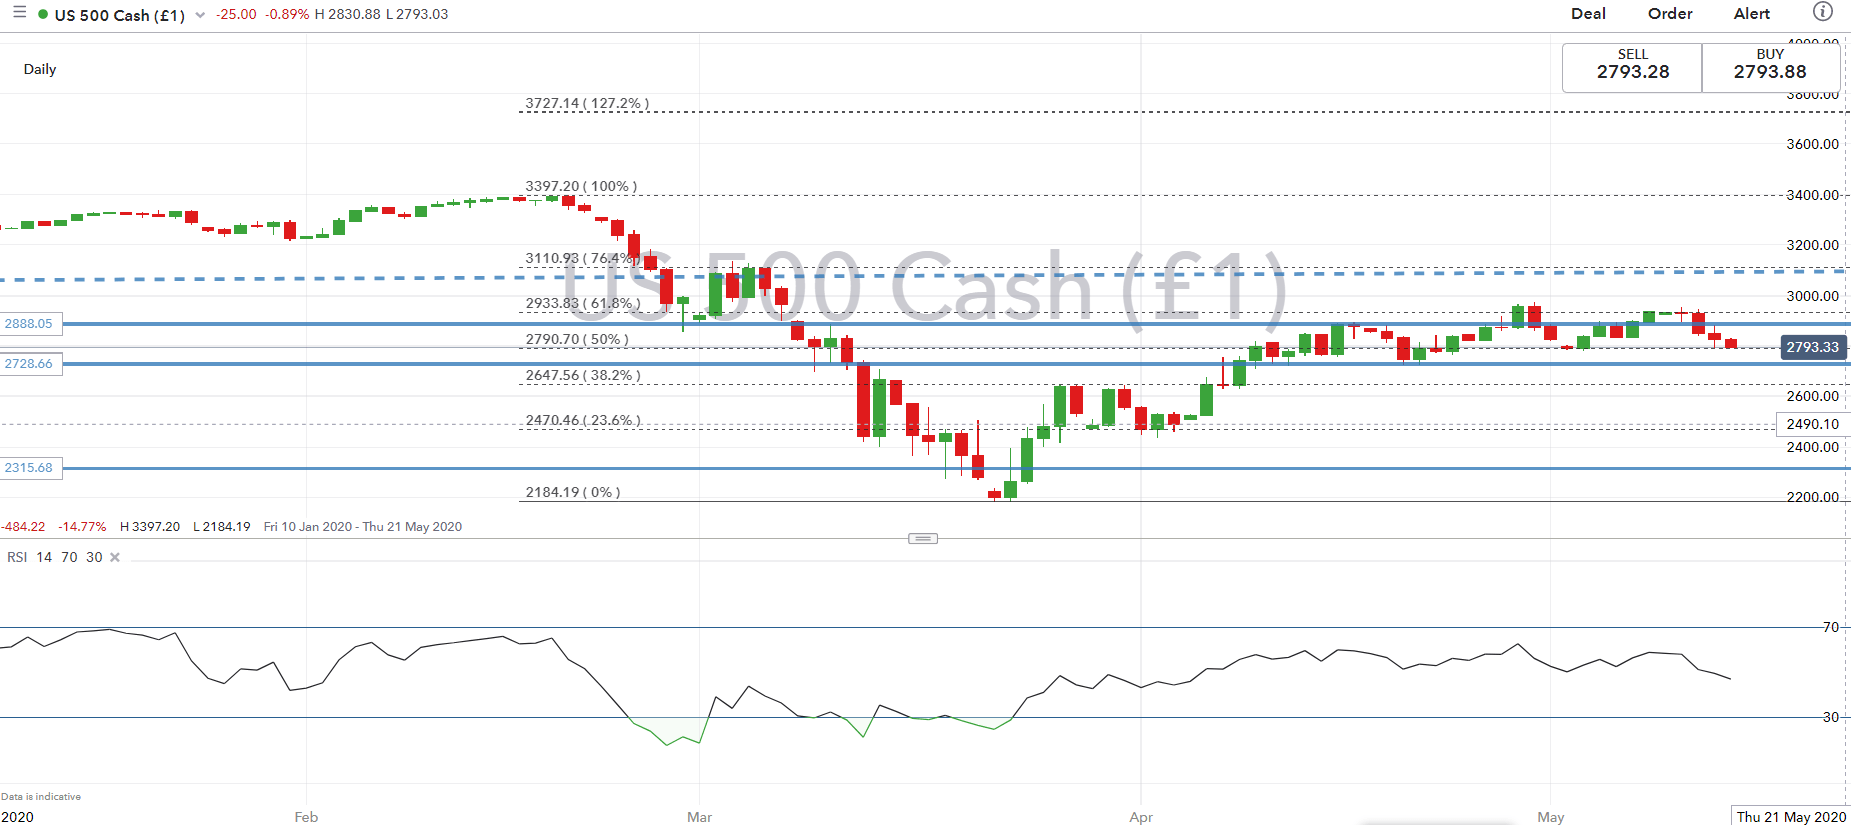
As we noted yesterday, risk-reward favours a pullback in risk appetite as US-China tensions added with concerns over a second coronavirus wave raises questions on the optimism of economies re-opening. The S&P 500 is testing support 2790-2800, which held in yesterdays session. However, with bouncebacks being somewhat shallow downside risks persist where a break below places focus onto 2750 before the April 21st low at 2726. On the topside, short-term resistance is situated at 2830-40.
| Change in | Longs | Shorts | OI |
| Daily | 2% | -7% | -3% |
| Weekly | 18% | -19% | -4% |
S&P 500 Price Chart: 1-Hourt Time Frame

Source: IG
S&500 Price Chart: Daily Time Frame
--- Written by Justin McQueen, Market Analyst
Follow Justin on Twitter @JMcQueenFX


