


Crude Oil Price, Chart and Outlook.
- June WTI contract expires on Tuesday, May 19.
- Lack of storage sent May WTI contract into record negative territory.
| Change in | Longs | Shorts | OI |
| Daily | -13% | 4% | -8% |
| Weekly | 6% | -23% | -5% |
US Crude Oil Traders Remain Wary Ahead of Futures Expiration
The US Commodity Futures Trading Commission (CFTC) sent out an advisory note on Wednesday May 13, warning members that ‘certain contracts may continue to experience extreme market volatility, low liquidity and possibly negative pricing’ as expiry dates near. The note highlighted the negative pricing experienced in the May WTI contract on April 20, one day before the contract expired. The price of the May WTI contract hit a record low of -$40/bbl. that day as traders unable to take physical delivery of oil sold at any price. The WTI contract specifies that traders who hold futures at expiry must take delivery.
The latest turnover figures seen on the CME suggest that traders are aware of the potential problems ahead and have moved out of the front month contract already, with volume in the July contract around six times that seen in the June contract.
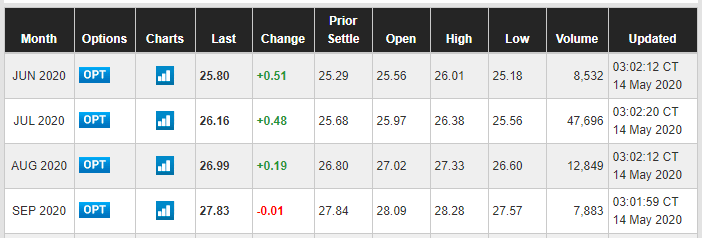
Prices and Volumes via CME.

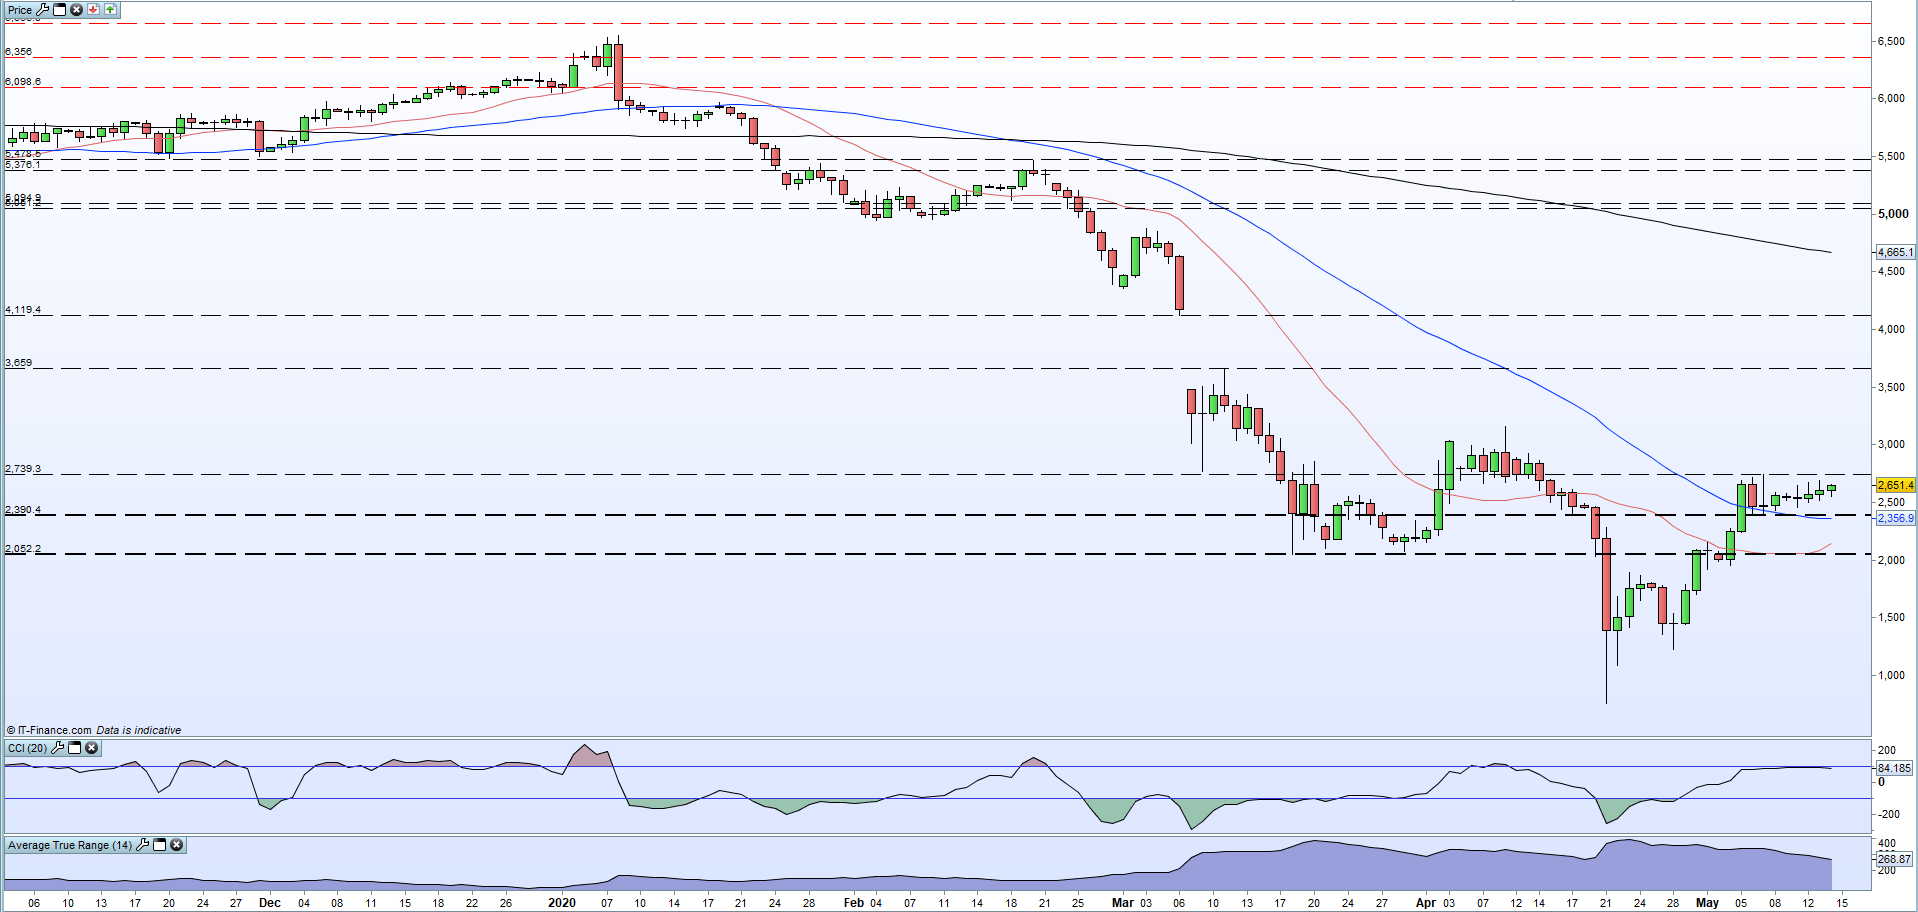
Looking at the daily US Crude chart – based on the two most liquid front-month contracts –the sharp rally from the April 20 low looks to be running out of steam. This week’s trading range has contracted sharply, although a series of recent higher lows continues to underpin the market. A break and close below $23.90/bbl. would wipe out the last week’s gains and leave the 50-dma at $23.56/bbl. and the 20-dma at $21.45/bbl. vulnerable. To continue the current positive sentiment, crude needs to close above $27.40/bbl.
US Crude Oil Daily Price Chart (November 2019 – May 14, 2020)
Traders may be interested in two of our trading guides – Traits of Successful Traders and Top Trading Lessons – while technical analysts are likely to be interested in our latest Elliott Wave Guide.
What is your view on Crude Oil – bullish or bearish?? You can let us know via the form at the end of this piece or via Twitter @nickcawley1.


