


The S&P 500 may be have double-topped with yesterday’s swift decline off the April 29 high. On a push lower the next level of support is 2798 followed by 2727. A breakout above 2954 doesn’t put the S&P into the clear with the 200-day not far above at 3000 and the gap-fills from March 5 and 6. For more on the US indices and the Dow Jones outlook, check out this piece.

S&P 500 Daily Chart (rolling over)

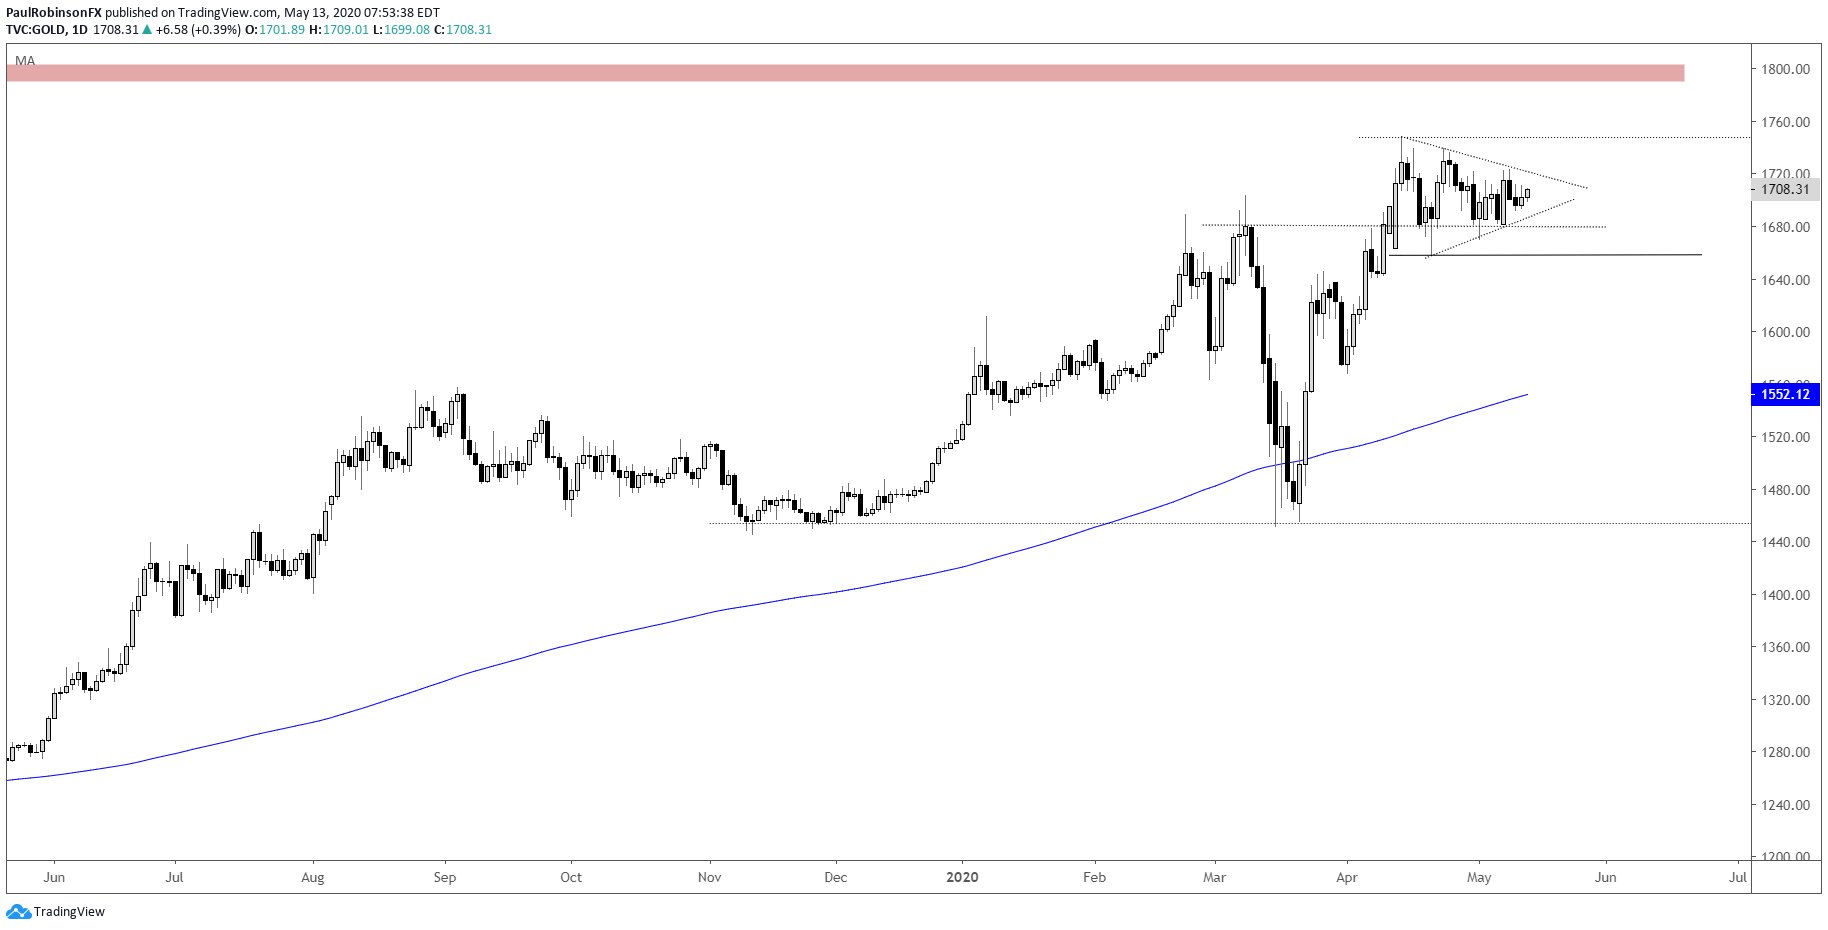
The Gold chart is coiling up into a symmetrical triangle, which suggests it could break out soon. The direction of the trend prior to its development implies an upside break, but these patterns can be tricky and break in either direction. In either event, break higher or lower, will first run with that and be ready to reverse course should the initial breakout turn into a false one. But overall, the diminishing volatility is set to give-way to higher volatility, and with price so close to the apex it should be soon.
Gold Daily Chart (symmetrical triangle forming)
The oil chart on the hourly is posting an ascending wedge at resistance. The higher lows in the pattern highlight an increased willingness by buyers despite price having a ceiling. We should see a breakout very soon. A breakout higher appears to be the path of least resistance, but we can’t rule a downside breakout.

Oil hourly Chart (ascending wedge)

To see all the charts we looked at, check out the video above…
Resources for Index & Commodity Traders
Whether you are a new or an experienced trader, DailyFX has several resources available to help you; indicator for tracking trader sentiment, quarterly trading forecasts, analytical and educational webinars held daily, and trading guides to help you improve trading performance.
We also have a series of guides for those looking to trade specific markets, such as the S&P 500, Dow, DAX, gold, silver, crude oil, and copper.
---Written by Paul Robinson, Market Analyst
You can follow Paul on Twitter at @PaulRobinsonFX


