British Pound (GBP) and FTSE 100 Prices and Analysis:


UK PM Boris Johnson has delayed announcing lockdown unwind measures until next week despite saying that the UK was ‘past the peak’ of the devastating coronavirus. The Prime Minister has pushed back announcing any measures to unwind the current lockdown until next week when he is set to reveal the government’s plans to help re-boot the ailing economy. The PM’s reticence to announce measures earlier stems from his fear that a second wave of COVID-19 could be even more devastating for the UK economy.
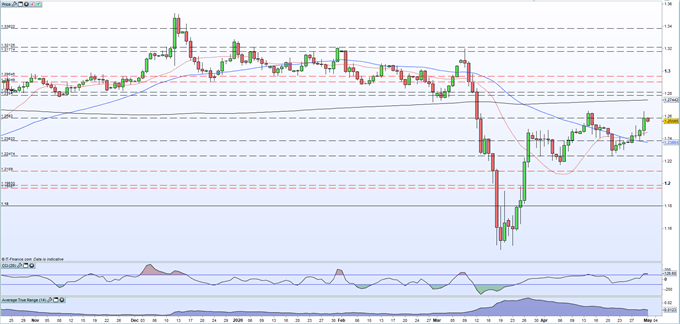
GBP/USD Falls Just Short
Sterling bounced late Thursday as month-end portfolio rebalancing saw inflows into the British Pound and outflows from the FTSE 100. GBP/USD also benefitted from a US dollar sell-off and the pair fell just short of breaking the April 14 multi-week high at 1.2648. The GBP/USD short-term uptrend remains in place and it is likely that the pair will consolidate recent gains before making its next move. Thursday’s low of 1.2428 is guarded by the 20-dma, currently at 1.2458, with the weekly low and the 50-dma clustered around 1.2360. Thursday’s high print will need a major driver to be broken.
GBP/USD Daily Price Chart (October 2019 – May 1, 2020)

| Change in | Longs | Shorts | OI |
| Daily | 1% | 3% | 2% |
| Weekly | -12% | 28% | 1% |
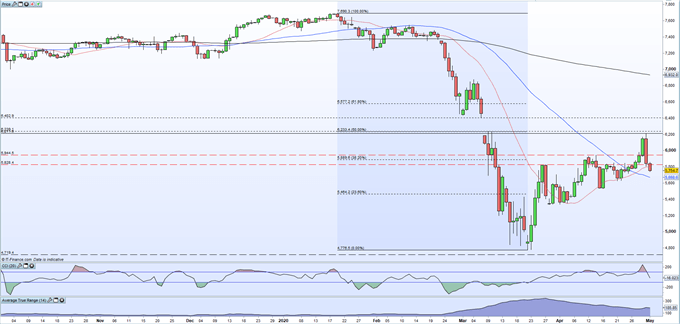
The FTSE 100 turned sharply lower Thursday as risk sentiment disappeared. After making a fresh six-week high of 6,211 – just 222 points below the bottom of the gap on the daily chart – the index sold-off sharply and continues to trade lower today. The strong rally off the March 22 low is said to have triggered month-end portfolio rebalancing, while comments overnight that US President Trump is going to ramp up the economic offensive against China have hit risk sentiment. A recent double-low around 5,625, coupled with the 50-dma at 5,668 looks likely as the first area of support. The CCI indicator has fallen sharply from extreme overbought conditions and may temper any further sharp moves lower.
FTSE 100 Daily Price Chart (October 2019 – May 1, 2020)

Traders may be interested in two of our trading guides – Traits of Successful Traders and Top Trading Lessons – while technical analysts are likely to be interested in our latest Elliott Wave Guide.
What is your view on Sterling (GBP) and the FTSE 100 – bullish or bearish?? You can let us know via the form at the end of this piece or you can contact the author via Twitter @nickcawley1.


