


GBP price, news and analysis:
- Crude oil prices remain under downward pressure but hopes are rising that coronavirus lockdowns will be eased in more countries.
- That will likely mean that “risk-on” assets such as the British Pound and stocks – including the FTSE 100 index – trade broadly sideways in the immediate future.
GBP/USD stable near-term
GBP/USD is trading sideways near-term and will likely continue to do so, alongside other riskier assets such as stocks, as hopes that many other countries will follow the lead of New Zealand and Italy and ease restrictions prompted by the coronavirus pandemic are offset by continuing turmoil in the markets for crude oil.
Optimism is growing that normal economic activity will be resumed in due course but crude oil prices have been hit again – this time by news that the United States Oil Fund, the country's largest crude exchange-traded fund, intends to sell all its front-month crude contracts to avoid a repeat of the heavy losses suffered last week on oversupply and a lack of storage space.
This has left GBP/USD and the Sterling crosses in limbo, although the Pound continues to edge marginally higher, as it has over the past week.
GBP/USD Price Chart, One-Hour Timeframe (April 22-28, 2020)
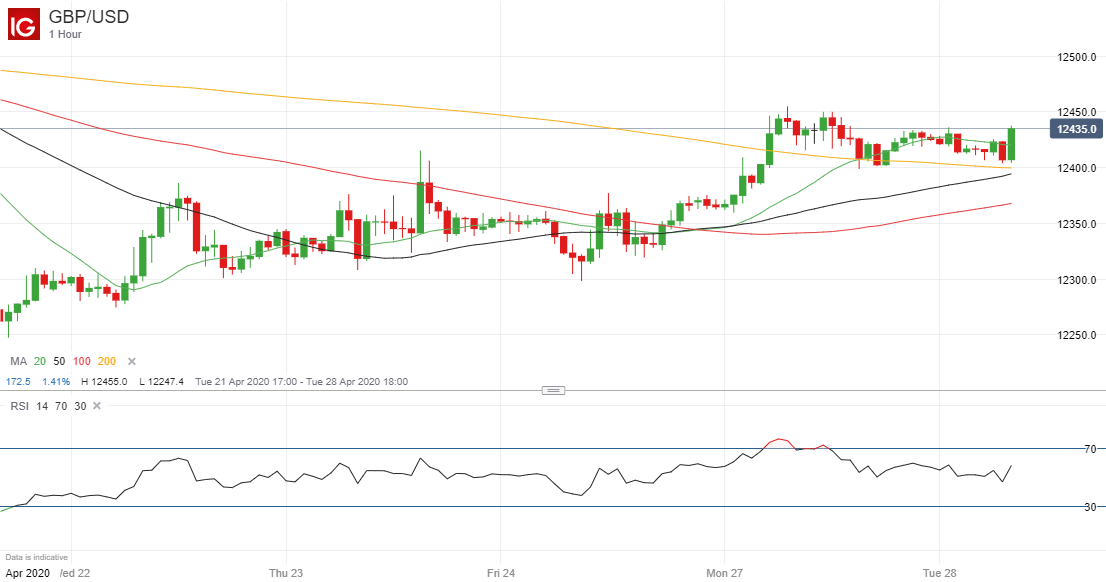
Chart by IG (You can click on it for a larger image)
| Change in | Longs | Shorts | OI |
| Daily | 0% | -17% | -6% |
| Weekly | -1% | -4% | -2% |
On the London stock market, the FTSE 100 index is also broadly unchanged in early business Tuesday and that too will likely continue to trade sideways even though results from energy company BP and the HSBC bank continue to show how leading UK companies are suffering due to Covid-19.
FTSE 100 Price Chart, Daily Timeframe (February 14 – April 28, 2020)
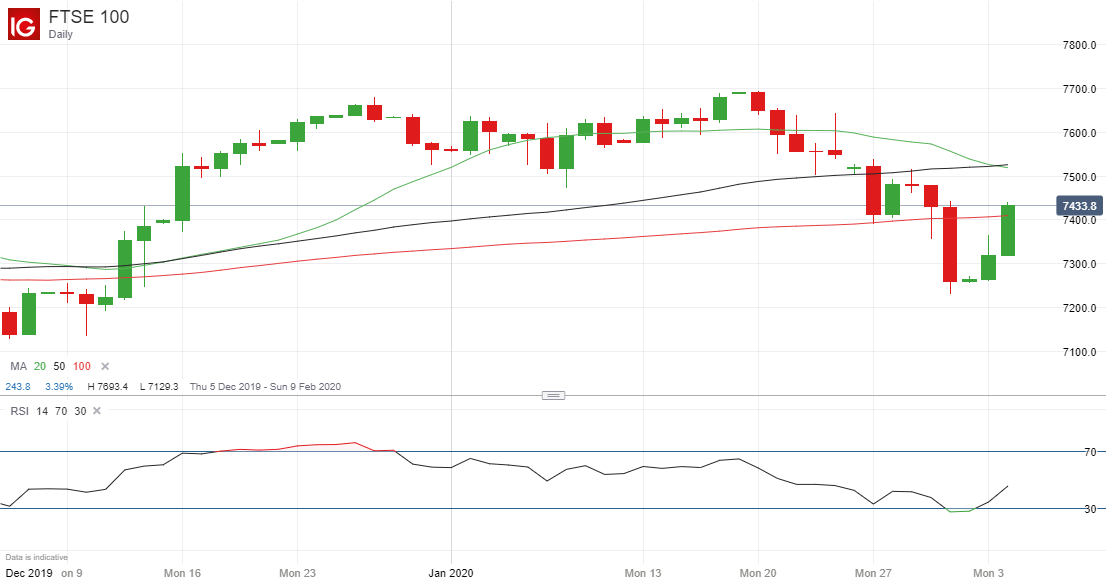
Chart by IG (You can click on it for a larger image)
A Brief History of Major Financial Bubbles, Crises, and Flash-crashes
We look at Sterling regularly in the DailyFX Trading Global Markets Decoded podcasts that you can find here on Apple or wherever you go for your podcasts
--- Written by Martin Essex, Analyst and Editor
Feel free to contact me via the comments section below


