


Technical Outlook:
- EUR/USD pressing long-term support
- USD/CAD currently at a cross-road
- USD/JPY contracting range suggest breakout soon
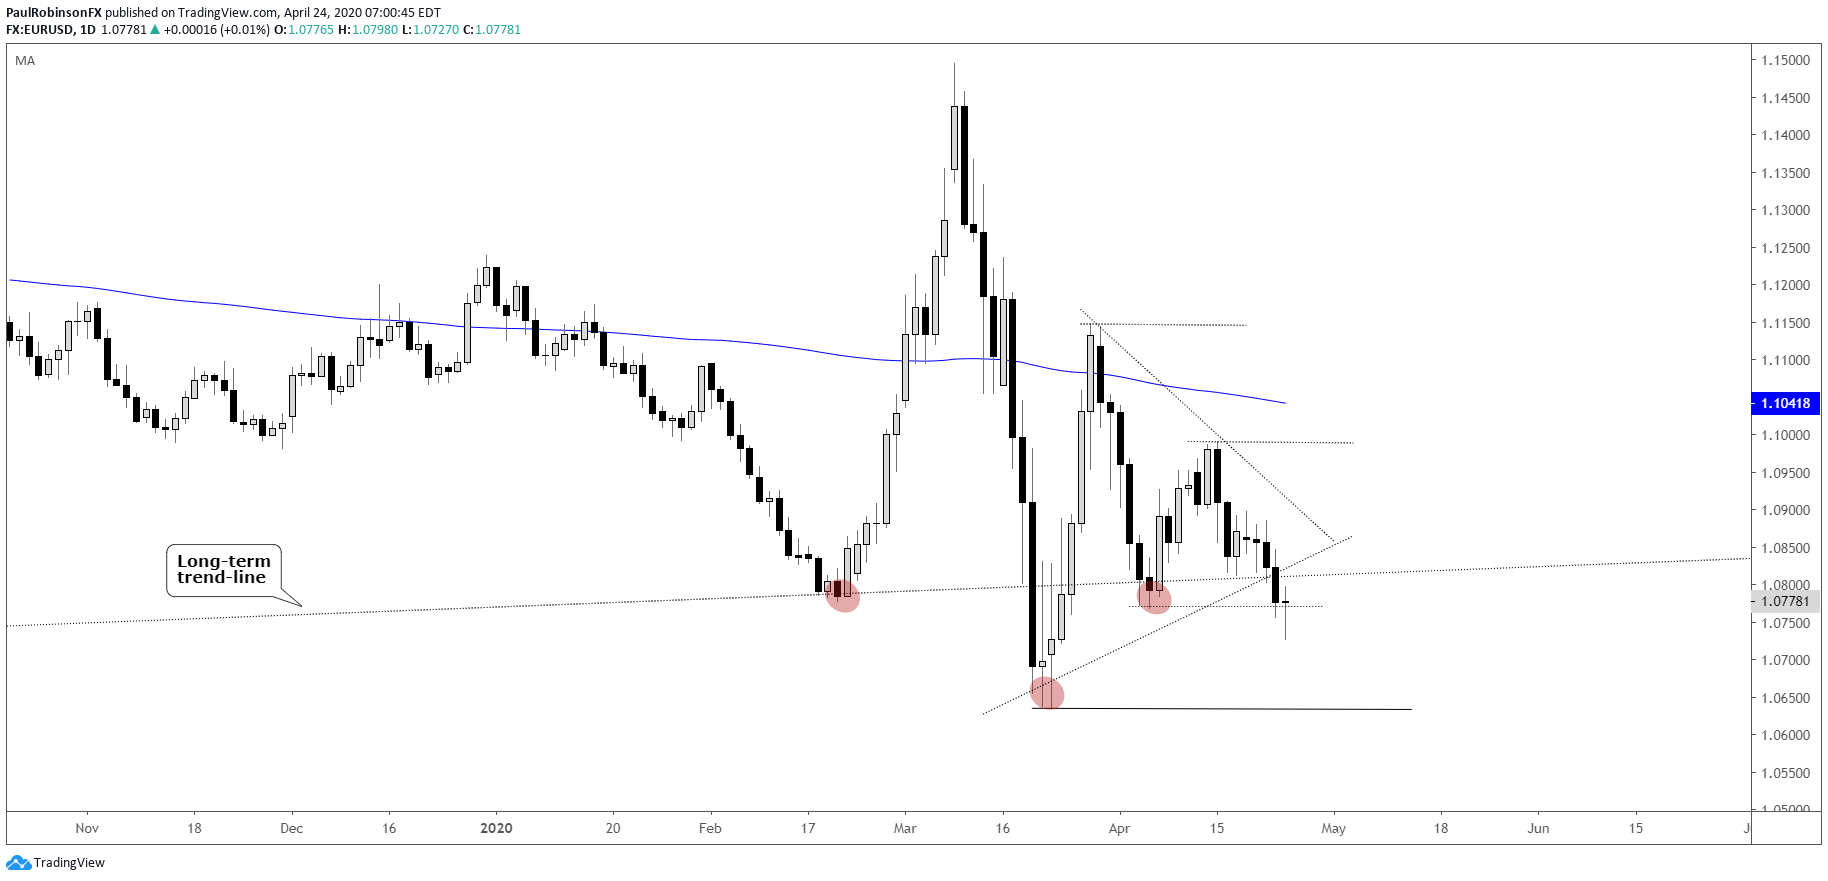
EUR/USD is working its way lower towards the important March low which was the first true attempt at breaking the 1985 to present trend-line. If last month’s low at 10635 breaks then we could quickly see the January 2017 low at 10340, parity, and worse. There is time for EUR/USD to strengthen and turn it around but the clock looks about ready to run out. Next week could be important.

EUR/USD Daily Chart (March low important around LT T-line)
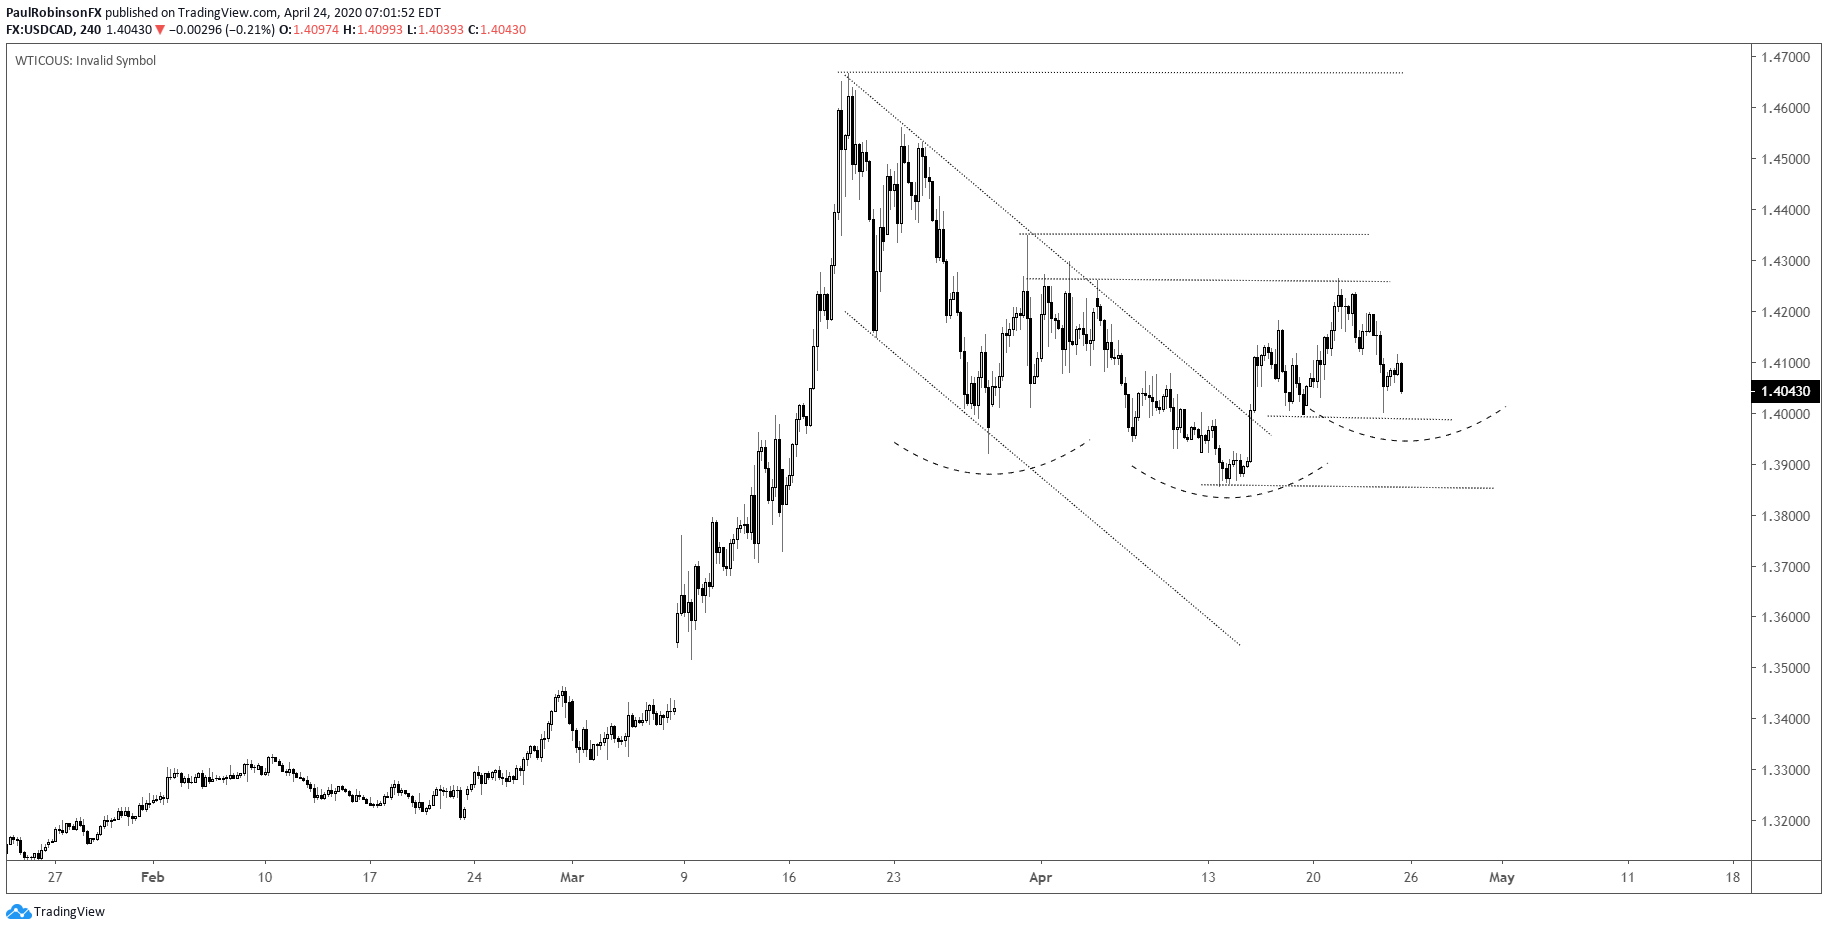
USD/CAD is weakening after tagging resistance over 14200, but could still be working on a broader base after coming out of the channel from the March high. A breakdown below 13996 would not be good though and likely lead to a leg lower. A strong break above 14265 on the hand should get USD/CAD back higher again towards the 14600 area.
USD/CAD 4-hr chart (could be basing, levels to watch)
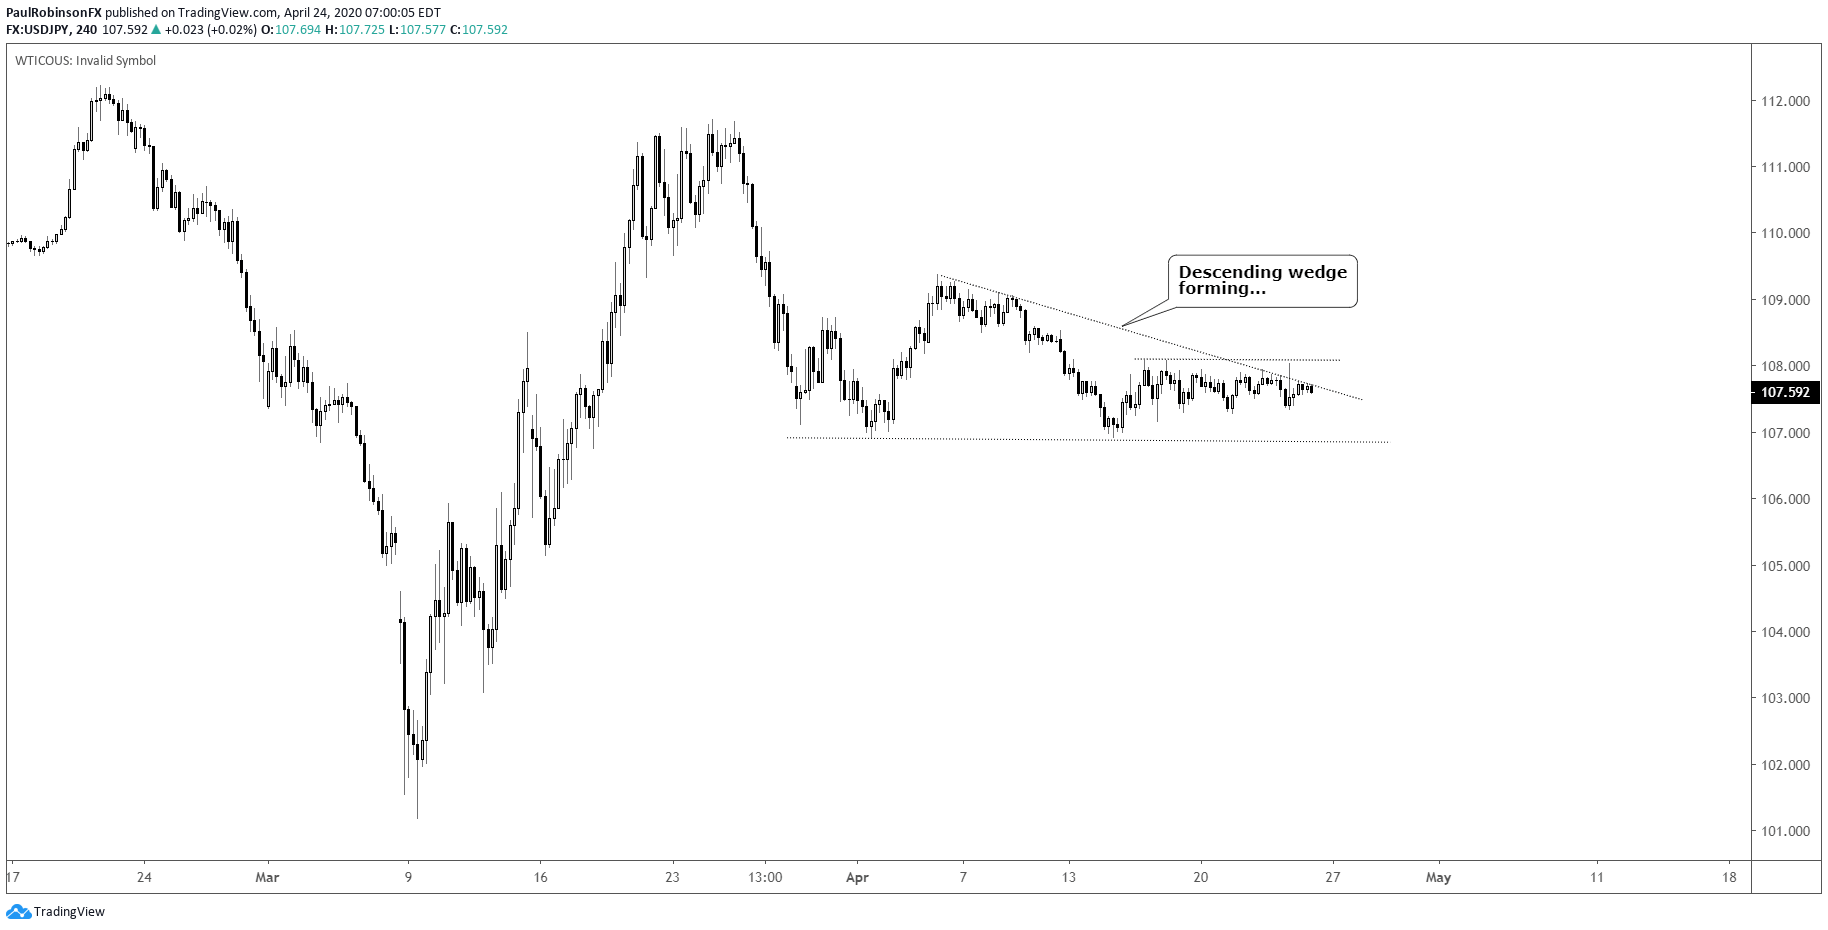
USD/JPY price action has died out considerably lately, which as a result has a descending wedge starting to come into visibility. The big level to watch here on the downside is 10692. A break below should have the pair rolling lower towards the 10400-area, possibly worse. A break higher may be a bit more challenging as a trade, with the 200-day just above and price moving against the recent sag in price action.
USD/JPY 4-hr chart (descending wedge in the works)
For all the charts we looked at, check out the video above…
Resources for Index & Commodity Traders
Whether you are a new or an experienced trader, DailyFX has several resources available to help you; indicator for tracking trader sentiment, quarterly trading forecasts, analytical and educational webinars held daily, and trading guides to help you improve trading performance.
We also have a series of guides for those looking to trade specific markets, such as the S&P 500, Dow, DAX, gold, silver, crude oil, and copper.
---Written by Paul Robinson, Market Analyst
You can follow Paul on Twitter at @PaulRobinsonFX


