


British Pound (GBP) and FTSE 100 - News, Prices and Analysis:

FTSE 100 Moving Higher as Drug Rumors Swirl Around the Market
Shares in US pharmaceutical manufacturer Gilead (GILD) are over 16% higher pre-US open after reports that the company’s antiviral drug remdesivir trials had shown positive results in treating patients with COVID-19. The trials at the University of Chicago showed that the drug quickly improved fever symptoms with nearly all of the patients involved in the trial being discharged within a week. The company said in a statement that they were waiting for additional data from ongoing trials.
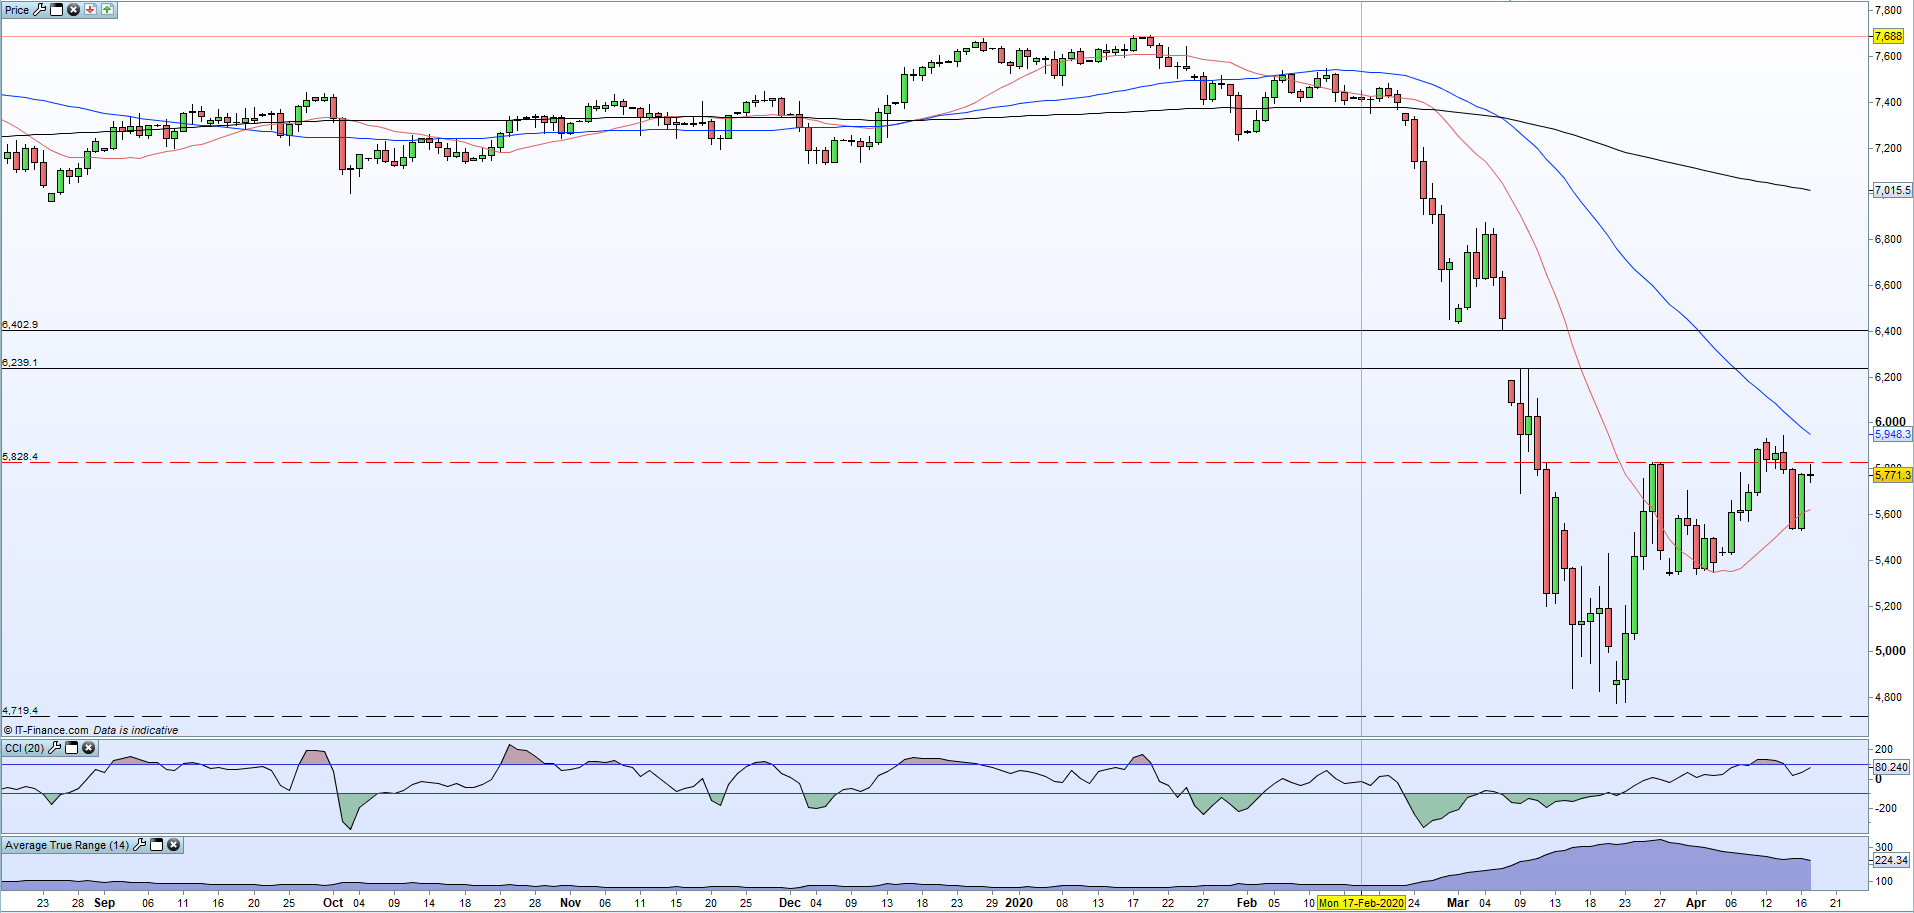
Risk markets open Friday higher with the FTSE 100 trading either side of 5,800, over 1,000 points higher than the March 22 nine-year low. Risk markets seem to be looking for any reason to rally higher and current levels may prove to be unsustainable until more is known about the effectiveness of the antiviral drug. FTSE 100 initial support is based off this week’s double-low around the 5,530 area before further supportive lows around 5,350. Resistance is seen at 5,950, where this week’s high meets the 50-day moving average.
FTSE 100 Daily Price Chart (August 2019 – April 17, 2020)
| Change in | Longs | Shorts | OI |
| Daily | 1% | 3% | 2% |
| Weekly | -11% | 25% | 1% |
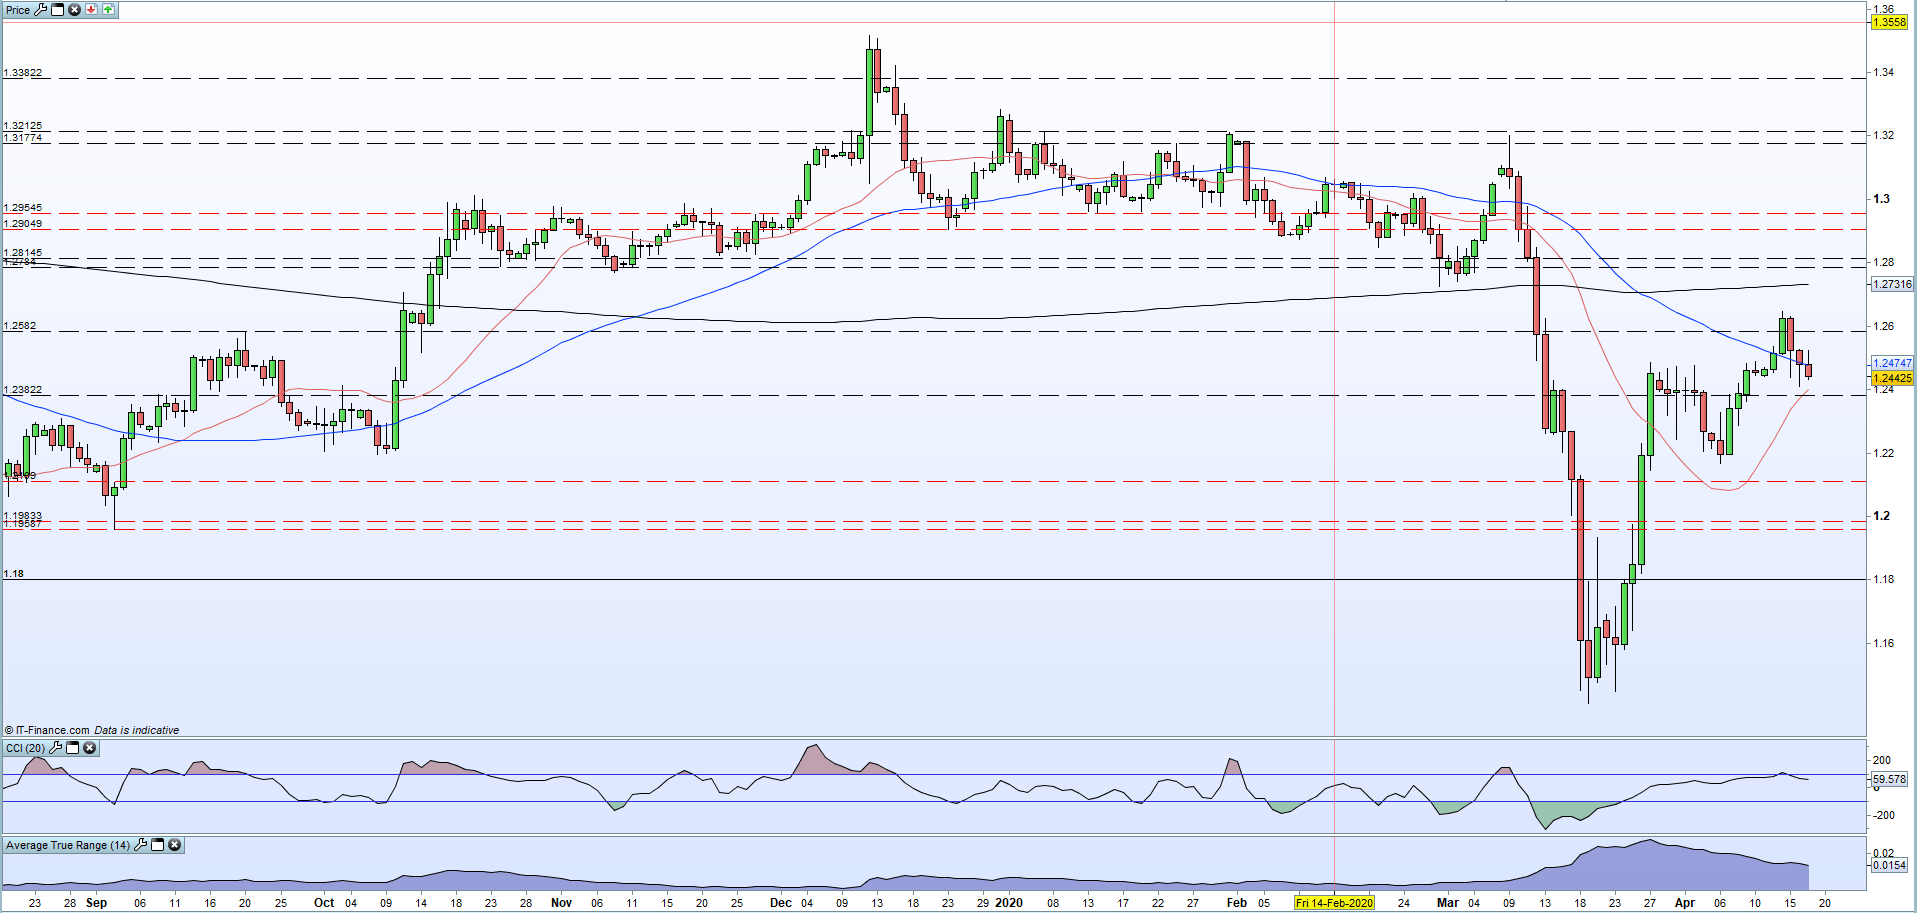
Sterling is nearing its lowest level in a week against the US dollar and may look to test support between 1.2400 (20-dma) and yesterday’s low print at1.2410. A three-day run of lower highs and lows needs to be broken if cable respects these support levels. The CCI indicator shows the pair have just moved out of overbought territory while the ATR indicator shows volatility continuing to move lower.
GBP/USD 100 Daily Price Chart (August 2019 – April 17, 2020)
Traders may be interested in two of our trading guides – Traits of Successful Traders and Top Trading Lessons – while technical analysts are likely to be interested in our latest Elliott Wave Guide.
What is your view on Sterling (GBP) and the FTSE 100 – bullish or bearish?? You can let us know via the form at the end of this piece or you can contact the author via Twitter @nickcawley1.


