


Crude Oil Price, Chart and Analysis.
- US crude oil fell over 65% in Q1, its worst quarterly performance in history.
- All eyes on potential Russia-Saudi Arabia truce
| Change in | Longs | Shorts | OI |
| Daily | 2% | -10% | -2% |
| Weekly | 28% | -33% | 3% |
Crude Oil Needs Fundamental Support Quickly
Talk last night that Russia and Saudi Arabia may declare a ceasefire in their recent output and price war was enough to send crude oil 7%-8% higher in a market dominated by sellers. While Wednesday’s percentage rise sounds impressive it pales into insignificance when compared to the 65%+ fall in crude in Q1 – over $40/bbl. - its worst quarterly performance in history. To help the oil market find a base, a truce between Russia and Saudi Arabia is essential, especially as global demand crumbles under the weight of the coronavirus pandemic. Friday’s US Labour report is now estimated by some to show 100,000 US workers joining the unemployment line.
DailyFX analyst Justin McQueen will be covering the US Non-Farm Payroll Release Live on Friday
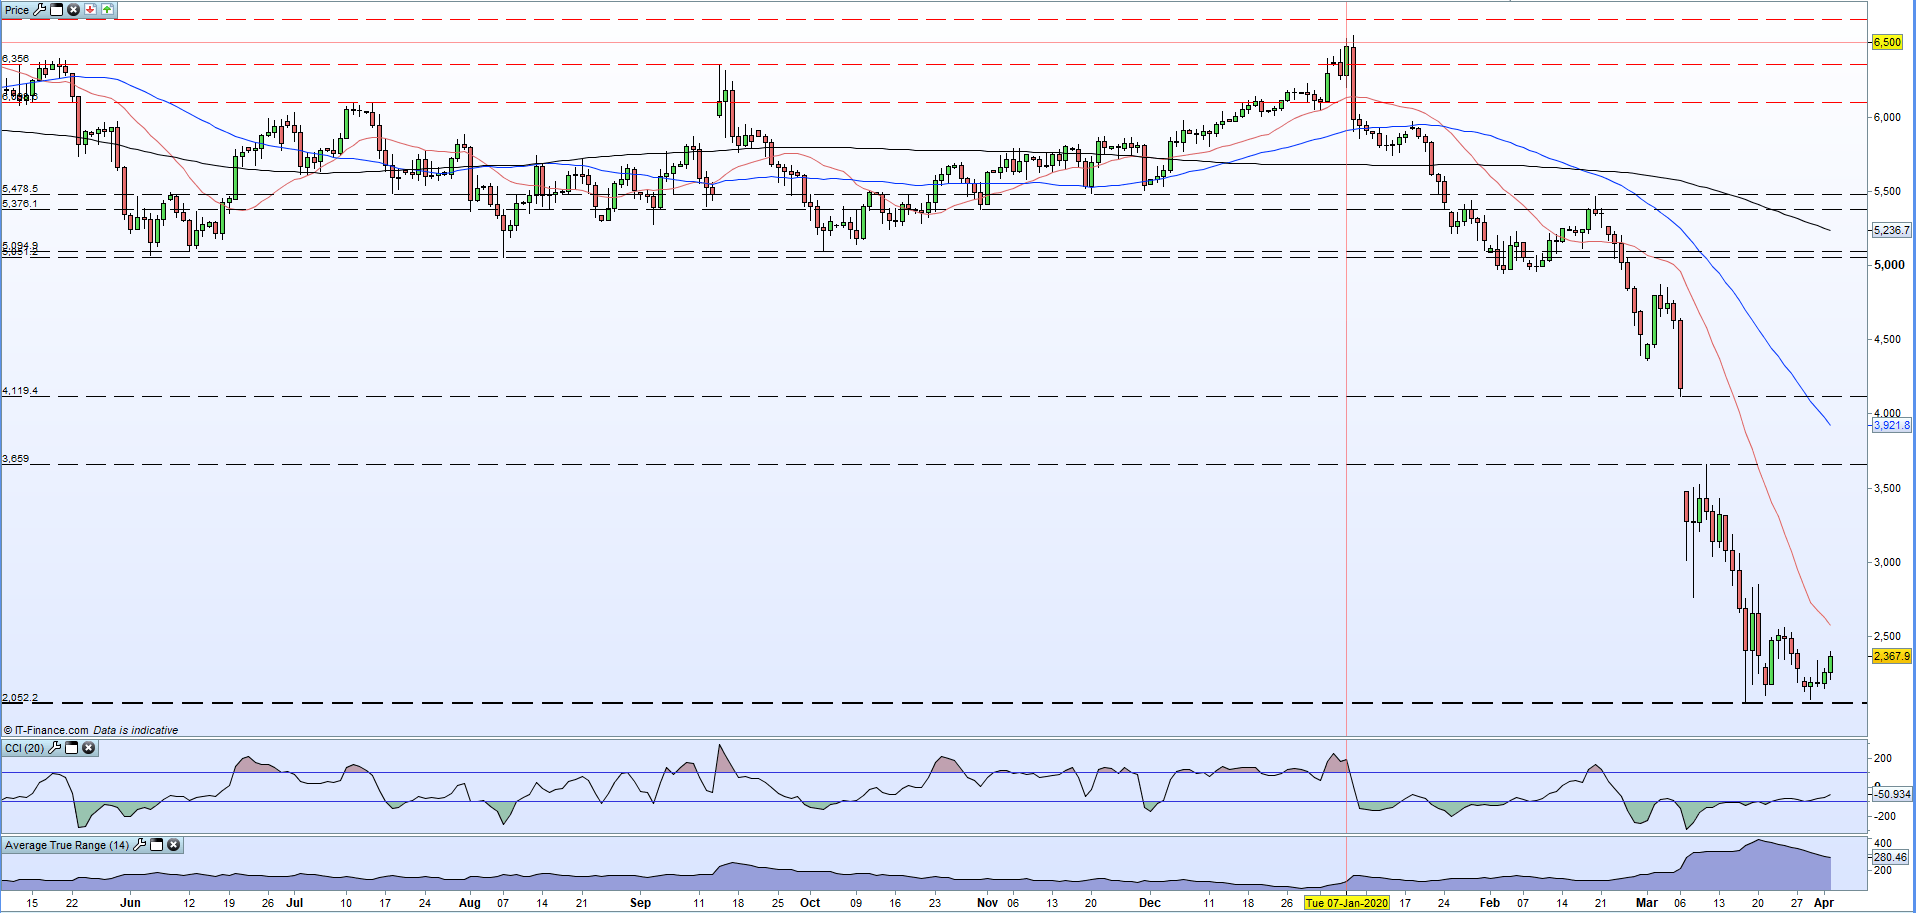
The daily oil chart shows little in the way of real support at the moment although the $20/bbl. area is providing a ‘big figure’ base of sorts. Small comfort can be taken from this week’s higher lows and sellers may stand to the side and wait for any news, with shorting at these extreme levels a very risk trade set-up. The March 25 high and the 20-dma cross at $25.70/bbl. and this may prove a secondary short-term target if $25.00/bbl. is taken out. In the longer-term, post-coronavirus hiatus, there is a big gap on the chart between $36.59/bbl. and $41.19/bbl. which needs filling.

Crude Oil Daily Price Chart (May 2019 - April 2, 2020)
Traders may be interested in two of our trading guides – Traits of Successful Traders and Top Trading Lessons – while technical analysts are likely to be interested in our latest Elliott Wave Guide.
What is your view on Crude Oil – bullish or bearish?? You can let us know via the form at the end of this piece or via Twitter @nickcawley1.


