


Crude Oil Price, Chart and Analysis.
- US crude has touched a fresh 17-year low.
- Coronavirus pandemic roils global economic activity
| Change in | Longs | Shorts | OI |
| Daily | 0% | -7% | -2% |
| Weekly | -7% | 1% | -5% |
Crude Oil Collapse Continues as Markets Ignore Central Bank Liquidity Flush
The collapse in the price of oil continues apace as the global spread of the coronavirus continues to shatter economic activity and market sentiment. The latest covid-19 news shows that 145 out of 195 countries are now infected with nearly 200,000 cases of infection and 7,980 fatalities. Countries around the globe are in or going into lockdown, destroying economic activity. Market estimations are now that most, if not all, major economies will soon report negative growth for the quarter with some predictions for Q1 and Q2 making grim reading. Global central banks are announcing massive new liquidity measures and rate cuts seemingly every day, yet financial markets continue to look into the abyss and sell-off further. More action is needed with extraordinary monetary and fiscal measures needed to restore any kind of market confidence.
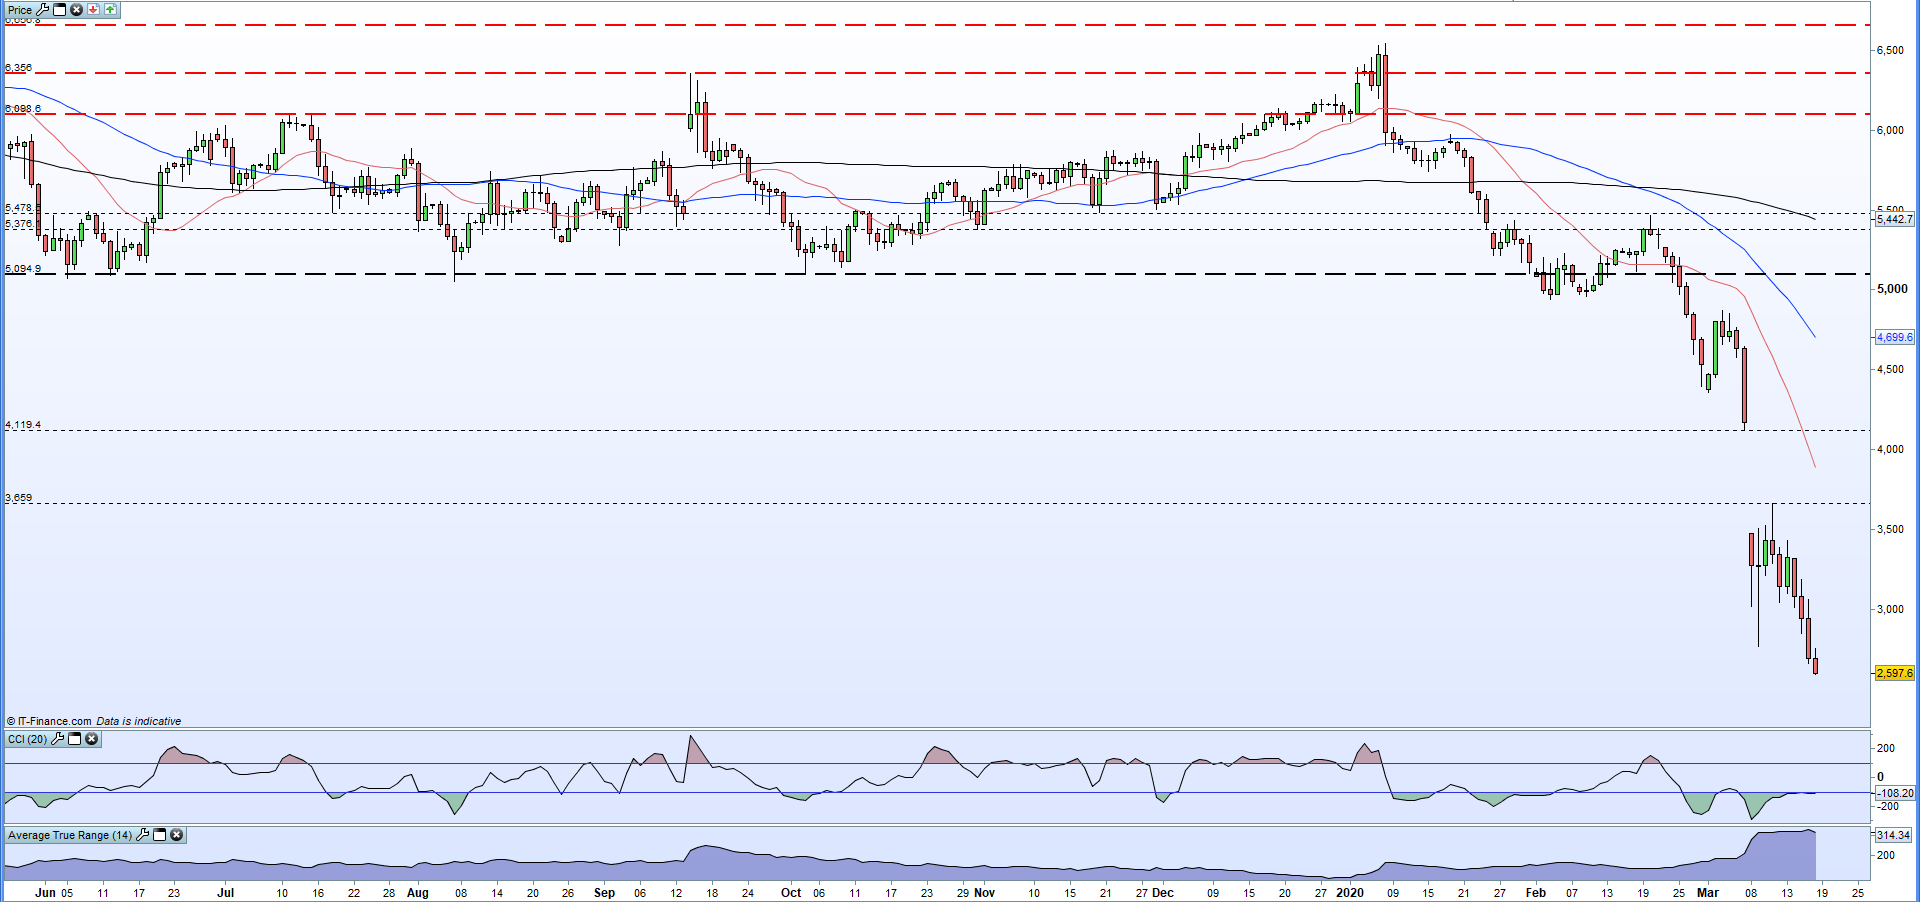
The daily US crude oil chart looks grim with a massive gap opened between March 6 and March 8, after OPEC abandoned further output cuts talk with Russia unwilling to participate. Saudi Arabia then announced it would increase production, including selling reserves, sending oil into a tailspin. The chart also shows a ‘death-cross’ formation – 50-dma trading through the 200-dma – a closely-watched negative signal. Oil currently trades around $26.00/bb. a level last seen in mid-2003, with hyper-bearish levels of horizontal support set at $17.12/bbl. (November 2001) and $10.65/bbl. (December 1998). These levels may be too extreme for even the most bearish trader but show the lack of any real technical support at current levels. It is likely that producers will begin shuttering their operations as output becomes unsustainable due to current price levels which may help to provide a floor for crude. To the upside, the recently opened gap may prove difficult to fill.
Volatility remains at extreme levels.

Crude Oil Daily Price Chart (June 2019 - March 18, 2020)
Traders may be interested in two of our trading guides – Traits of Successful Traders and Top Trading Lessons – while technical analysts are likely to be interested in our latest Elliott Wave Guide.
What is your view on Crude Oil – bullish or bearish?? You can let us know via the form at the end of this piece or via Twitter @nickcawley1.


