


Gold Price Analysis and Talking Points
- Gold Prices Losing its Safe-Haven Status?
- COT shows that Investors Remain Bullish on the Precious Metal
- Margin Calls Raise Short Term Risks for Gold
Gold Performance: In recent weeks, the price action in gold has caught many market participants off guard having fallen over 8%, while global equities have crashed. Therefore, raising doubts as to whether gold is an appropriate hedge for the rout in equities.
| Change in | Longs | Shorts | OI |
| Daily | 3% | -5% | -1% |
| Weekly | 12% | 3% | 7% |
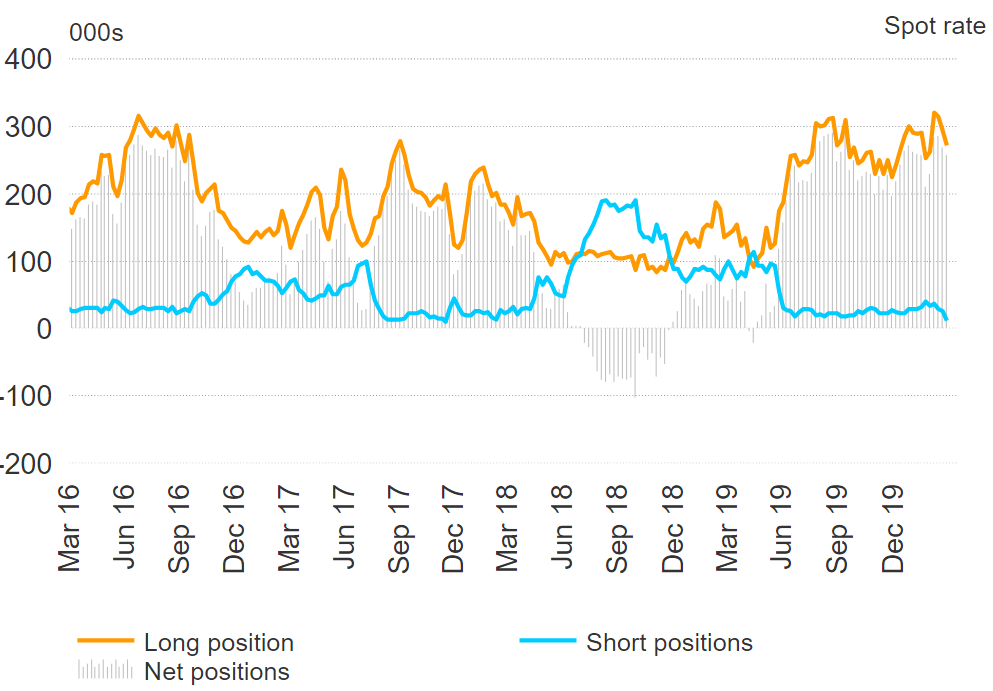
Positioning: When looking at the recent CFTC positioning data, investors remain very bullish on the precious metal (21% net long adjusted for open interest), despite a slight pullback in gross longs. That said, short positions have also edged lower, that investors are not yet beginning to turn bearish on the precious metal (figure 1). Elsewhere, ETF holdings of gold (SPDR Gold ETF) have shown that investors have begun to unwind their positions, falling over 3% from its peak reached on March 9th.
Figure 1: Investors Continue to Hold Large Bullish Positions in Gold
Margin Call: The pressure in gold prices can be attributed to margin call induced liquidation where investors would unwind their positions, they had built up in order to raise cash and offset their losses. This has been evident in gold where on February 28th the precious metal saw one of its largest intra-day falls since June 2013, while liquidations had also been touted for last week’s price action. Of note, Bank of America highlighted that investors had piled a record amount into cash-like assets, totaling $137bln through the week ending March 11th.

Financial Crisis: The current performance of gold is not out of the ordinary during these turbulent times, given that the precious metal had also sold during the 2008 crisis when equity markets saw sizeable double-digit losses. However, gold did outperform relative to the equities with pullbacks modest (figure 2).
Figure 2: Gold Also Dropped in the Global Financial, However, Outperformed Equities
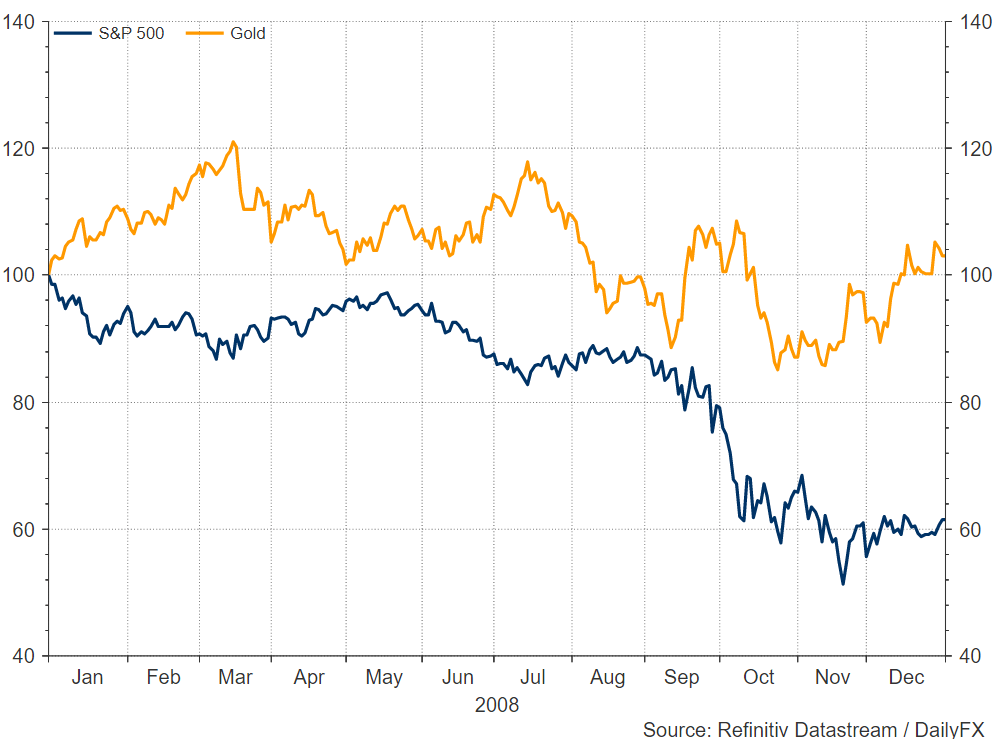
*The chart shows the performance of the gold and the S&P 500 during the financial crisis.
Monetary Stimulus: Despite the Federal Reserve slashing interest rates back to zero and announced QE4. The precious metal has failed to benefit; however, we are cognizant of the fact that it took two years into the recovery for gold prices to hit a record high of $1921 in 2011. As such, while there are risks of short-term dips in the precious metal, with the global economy likely to remain uncertain in the longer term we see risks remain skewed to the upside in gold. Alongside this, on the physical market, gold prices are at a double digit premium relative to paper trading and thus this supports the view that gold remains in high demand.
GOLD PRICE CHART: Weekly Time-Frame
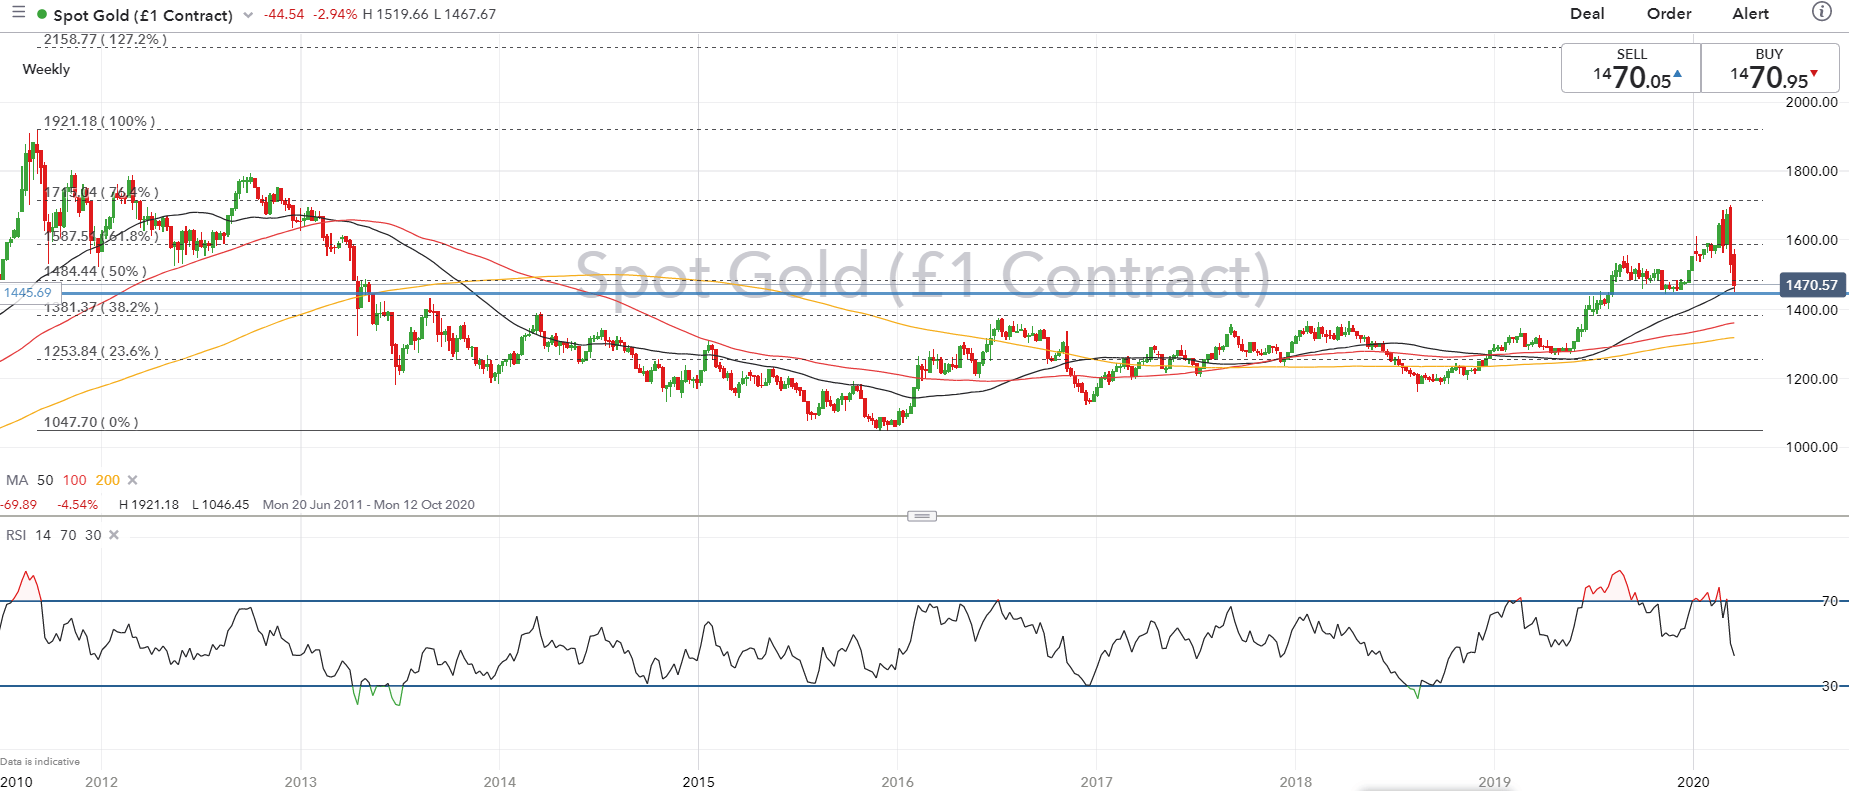
Source: IG Charts
--- Written by Justin McQueen, Market Analyst
Follow Justin on Twitter @JMcQueenFX


