


ASX 200 & Nikkei 225 Forecast:
- The ASX 200 will look to hold above a Fibonacci level derived from the 2009 to 2020 bull run
- The Nikkei 225 may look for assistance from horizontal levels nearby as selling appears to slow
- Despite relatively calm price action, volatility remains immense compared to historical averages
ASX 200 & Nikkei 225 Price Outlook: Stocks and Sentiment Steady, For Now
The Australian and Japanese equity markets have suffered alongside their developed, and indeed global, counterparts this month and were some of the first to feel the parasitic economic effects of the coronavirus. Now that the virus has become a global pandemic and governments have responded in addition to their central banks, it appears market panic has stalled – at least for the time being. In turn, global equity markets have moved off their lows after suffering a historic daily decline on Monday.
ASX 200 Price Chart: Weekly Time Frame (2009 – 2020)

Chart created with TradingView
While sentiment has surely improved, it also remains undeniably vulnerable as the world grapples with an unprecedented economic headwind. Therefore, continued volatility is likely – as the VIX would suggest – and technical trading levels may still be tested. In the case of the ASX 200, the RBA has offered lower rates in an attempt to buoy its economy.

Moving forward, the Australian equity index will look to trade above the Fibonacci level around 4,665 which is derived from the Fibonacci retracement drawn from the 2009 lows and 2020 high. To the topside, initial resistance in the event of a sustained recovery may reside around the 2018 low at 5,400 followed by confluent resistance near 5,620.
Nikkei 225 Price Outlook
Shifting to the Japanese Nikkei 225, price action reveals a similarly dire picture despite a relatively low number of domestic coronavirus cases given the country’s proximity to the initial outbreak and size. Nevertheless, central bank intervention has been offered and stimulus assured so the Nikkei 225 has enjoyed its own pause above support around 16,110 – the index’s November 2016 swing low.
Nikkei 225 Price Chart: Daily Time Frame (March 2016 – March 2020)
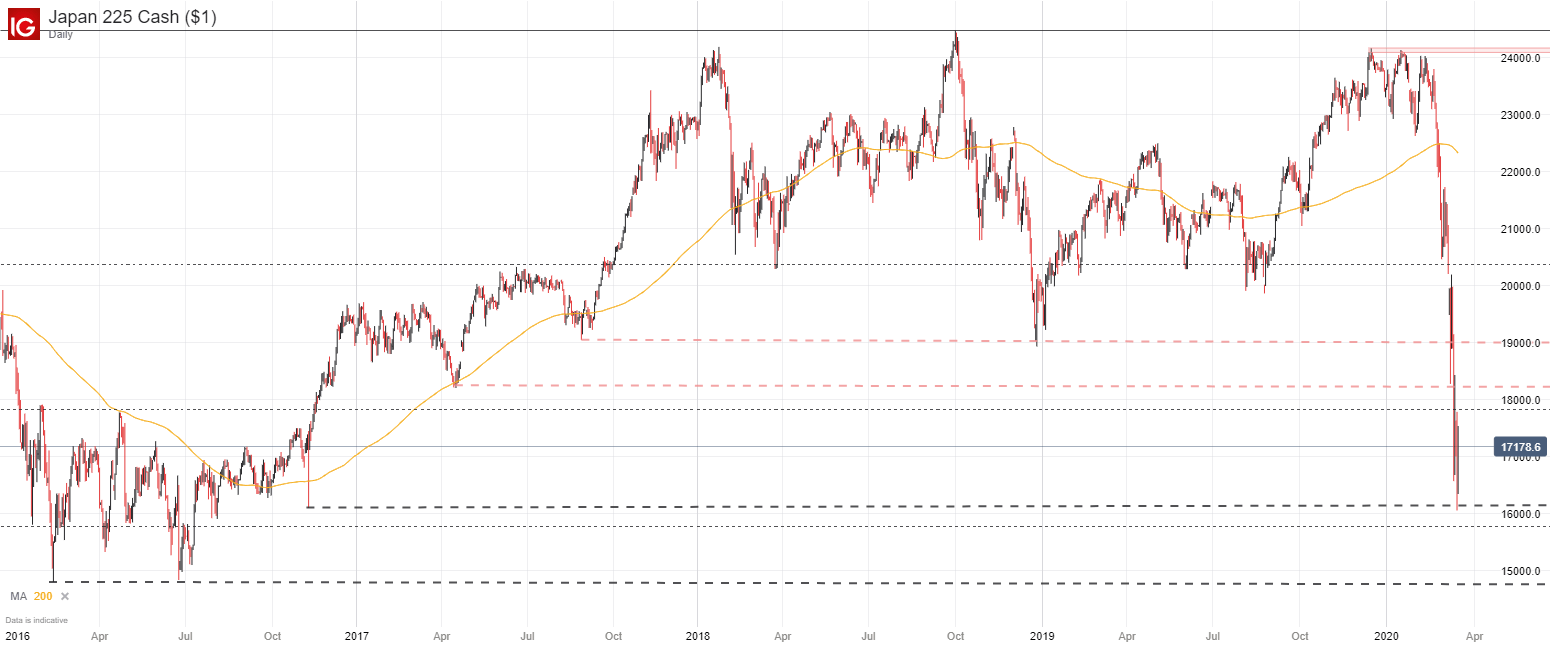
Nevertheless, the Japanese economy stood on shaky footing prior to the global pandemic and analysts already harbored concerns regarding the country’s dependency on stimulus from its central bank. Thus, I am hesitant to suggest the Nikkei will enjoy a parabolic recovery should risk appetite reemerge in earnest, but initial resistance will look to reside around 18,212 followed by the 19,050 area regardless.
While it appears traders and investors are beginning to consider risk exposure once again, the fundamental situation remains extremely fluid and volatile. With this in mind, it is important to stay cognizant of the most recent developments by checking back at DailyFX.
--Written by Peter Hanks, Junior Analyst for DailyFX.com
Contact and follow Peter on Twitter @PeterHanksFX


