


Technical Outlook:
- GBP/USD broke lower into area of support
- USD/JPY looks vulnerable to more selling
- NZD/USD is trying to hold onto a 20-yr trend-line
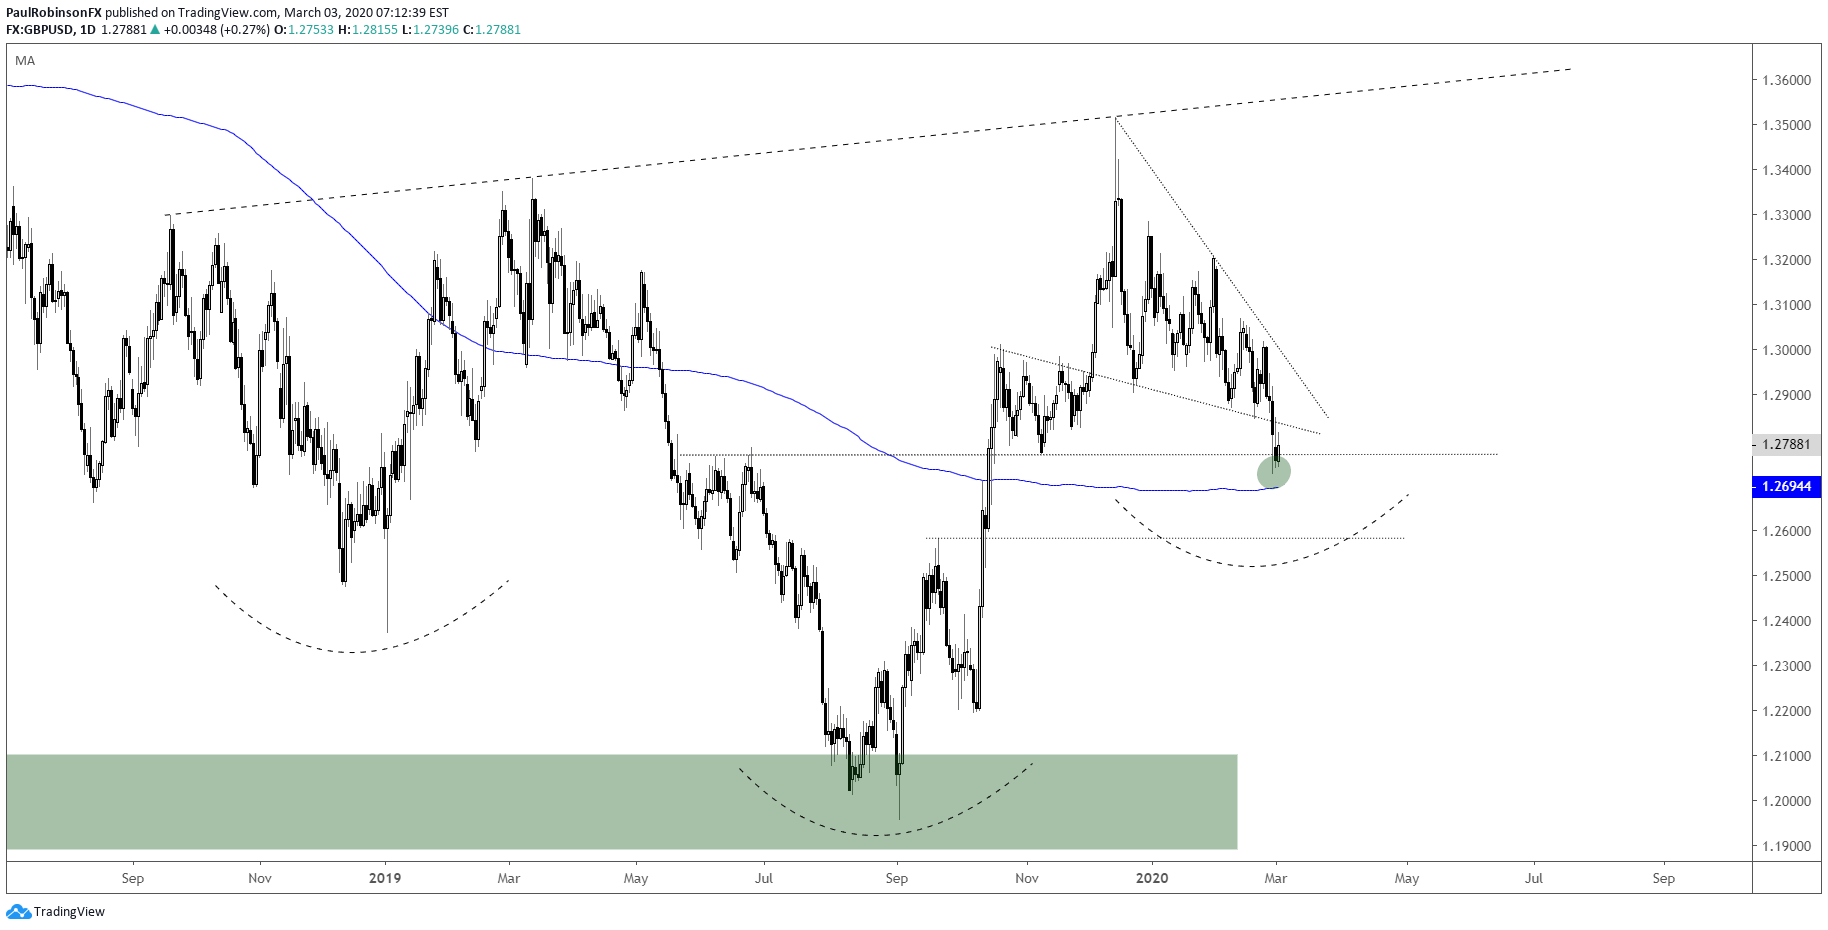
GBP/USD finally went on the move last week and broke down out of a descending wedge-like formation. However, it is unclear how much momentum it will garner to the downside. Right now, it is sitting on a decent level of support just under 12800, and not too far below just under 12700 lies the 200-day MA. Shorting here at support is not favored, however, buying without having bullish price action isn’t either. At the moment it is wait-and-see, but with FX volatility rising and EU/UK trade negotiations this month we should see price action free up and potentially provide a nice directional opportunity. Long-term, there remains bottoming potential via an inverse head-and-shoulders pattern.

GBP/USD Daily Chart (sitting on support)
USD/JPY is looking vulnerable as it sits below trend-line support and remains leaning lower, generally speaking. The backdrop isn’t supportive either, with stress remaining in financial markets despite the big bounce in equity prices. This could lead to further yen buying in the days ahead which will help fuel USD/JPY and JPY-crosses lower. The next level of support on weakness is 10648, followed by the August low under 10500.

USD/JPY Daily Chart (below support, at risk of further selling)

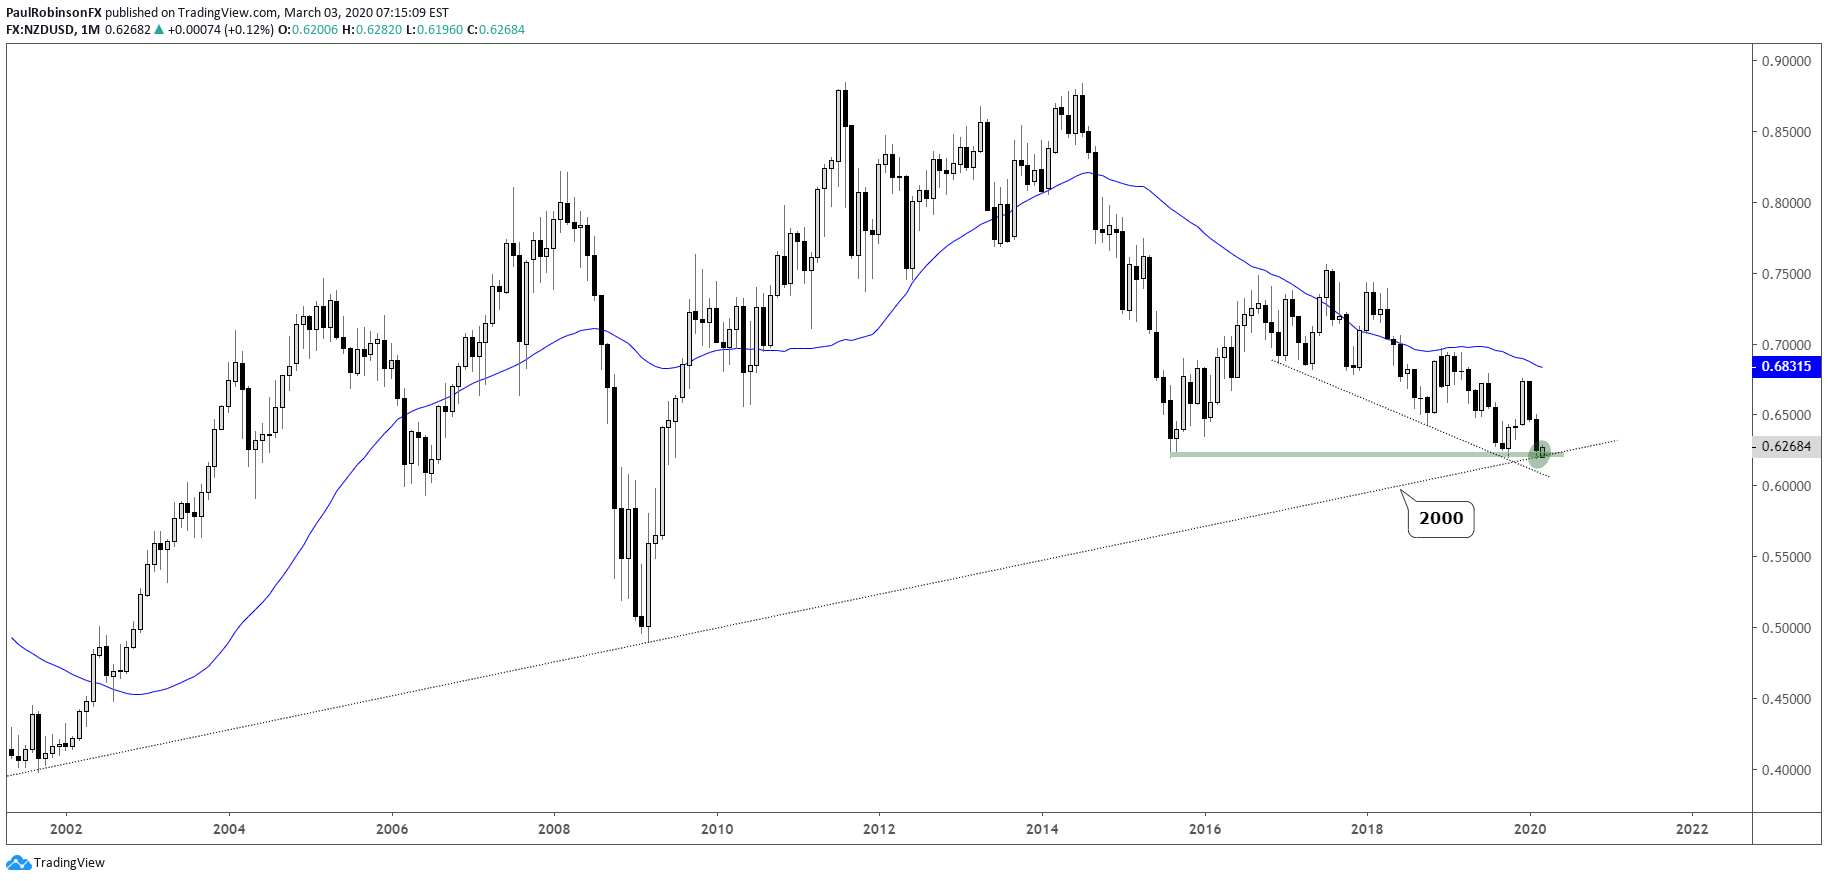
The NZD/USD rout was vicious, but now has long-term support at its feet via a nearly 20-yr trend-line. This also includes the low registered in Q3 that was breached only momentarily. We could see kiwi stabilize here, but it might not turn into a rip-roaring rally with financial markets in a wobbly state. A weekly close below 6194 could open a path for more losses.
NZD/USD Monthly Chart (sitting on 20-yr trend-line)
NZD/USD Daily Chart (may bounce a bit)

For all the charts we looked at, check out the video above…
Resources for Index & Commodity Traders
Whether you are a new or an experienced trader, DailyFX has several resources available to help you; indicator for tracking trader sentiment, quarterly trading forecasts, analytical and educational webinars held daily, and trading guides to help you improve trading performance.
We also have a series of guides for those looking to trade specific markets, such as the S&P 500, Dow, DAX, gold, silver, crude oil, and copper.
---Written by Paul Robinson, Market Analyst
You can follow Paul on Twitter at @PaulRobinsonFX


