


Dow Jones Price Outlook:
- The Dow Jones is on pace for its worst week since the Great Financial Crisis in October 2008
- Consequently, the DJIA has moved to threaten critical technical support as risk aversion persists
- Will the Stock Market Crash in 2020?
Dow Jones Forecast: Stock Selloff Deepens to Historic Levels
The Dow Jones surrendered nearly 1,200 points on Thursday, putting weekly losses at a total of 3,235 points heading into Friday’s session. Quoted in a less sensationalistic denomination, the Dow’s -11% decline this week is equally remarkable and has thrust the Industrial Average into correction territory just days after it was establishing new highs.
Officially defined as a -10% decline from a recent high, each of the Dow Jones, S&P 500 and Nasdaq 100 closed in a technical correction on Thursday. Further, the Dow Jones and S&P 500 are on pace for their worst weekly performances since 2008 during the Great Financial Crisis. With the S&P 500 down -12.5% from last Thursday, a technical bear market stands just 7.5% away.
In conjunction with the record-setting pace at which losses were established, the technical picture may suggest further weakness ahead. As selling accelerated into the close, the Industrial Average plunged beneath a longstanding band of support that had worked to buoy price several times since early 2018.
Dow Jones Price Chart: Daily Time Frame (January 2018 – February 2020)
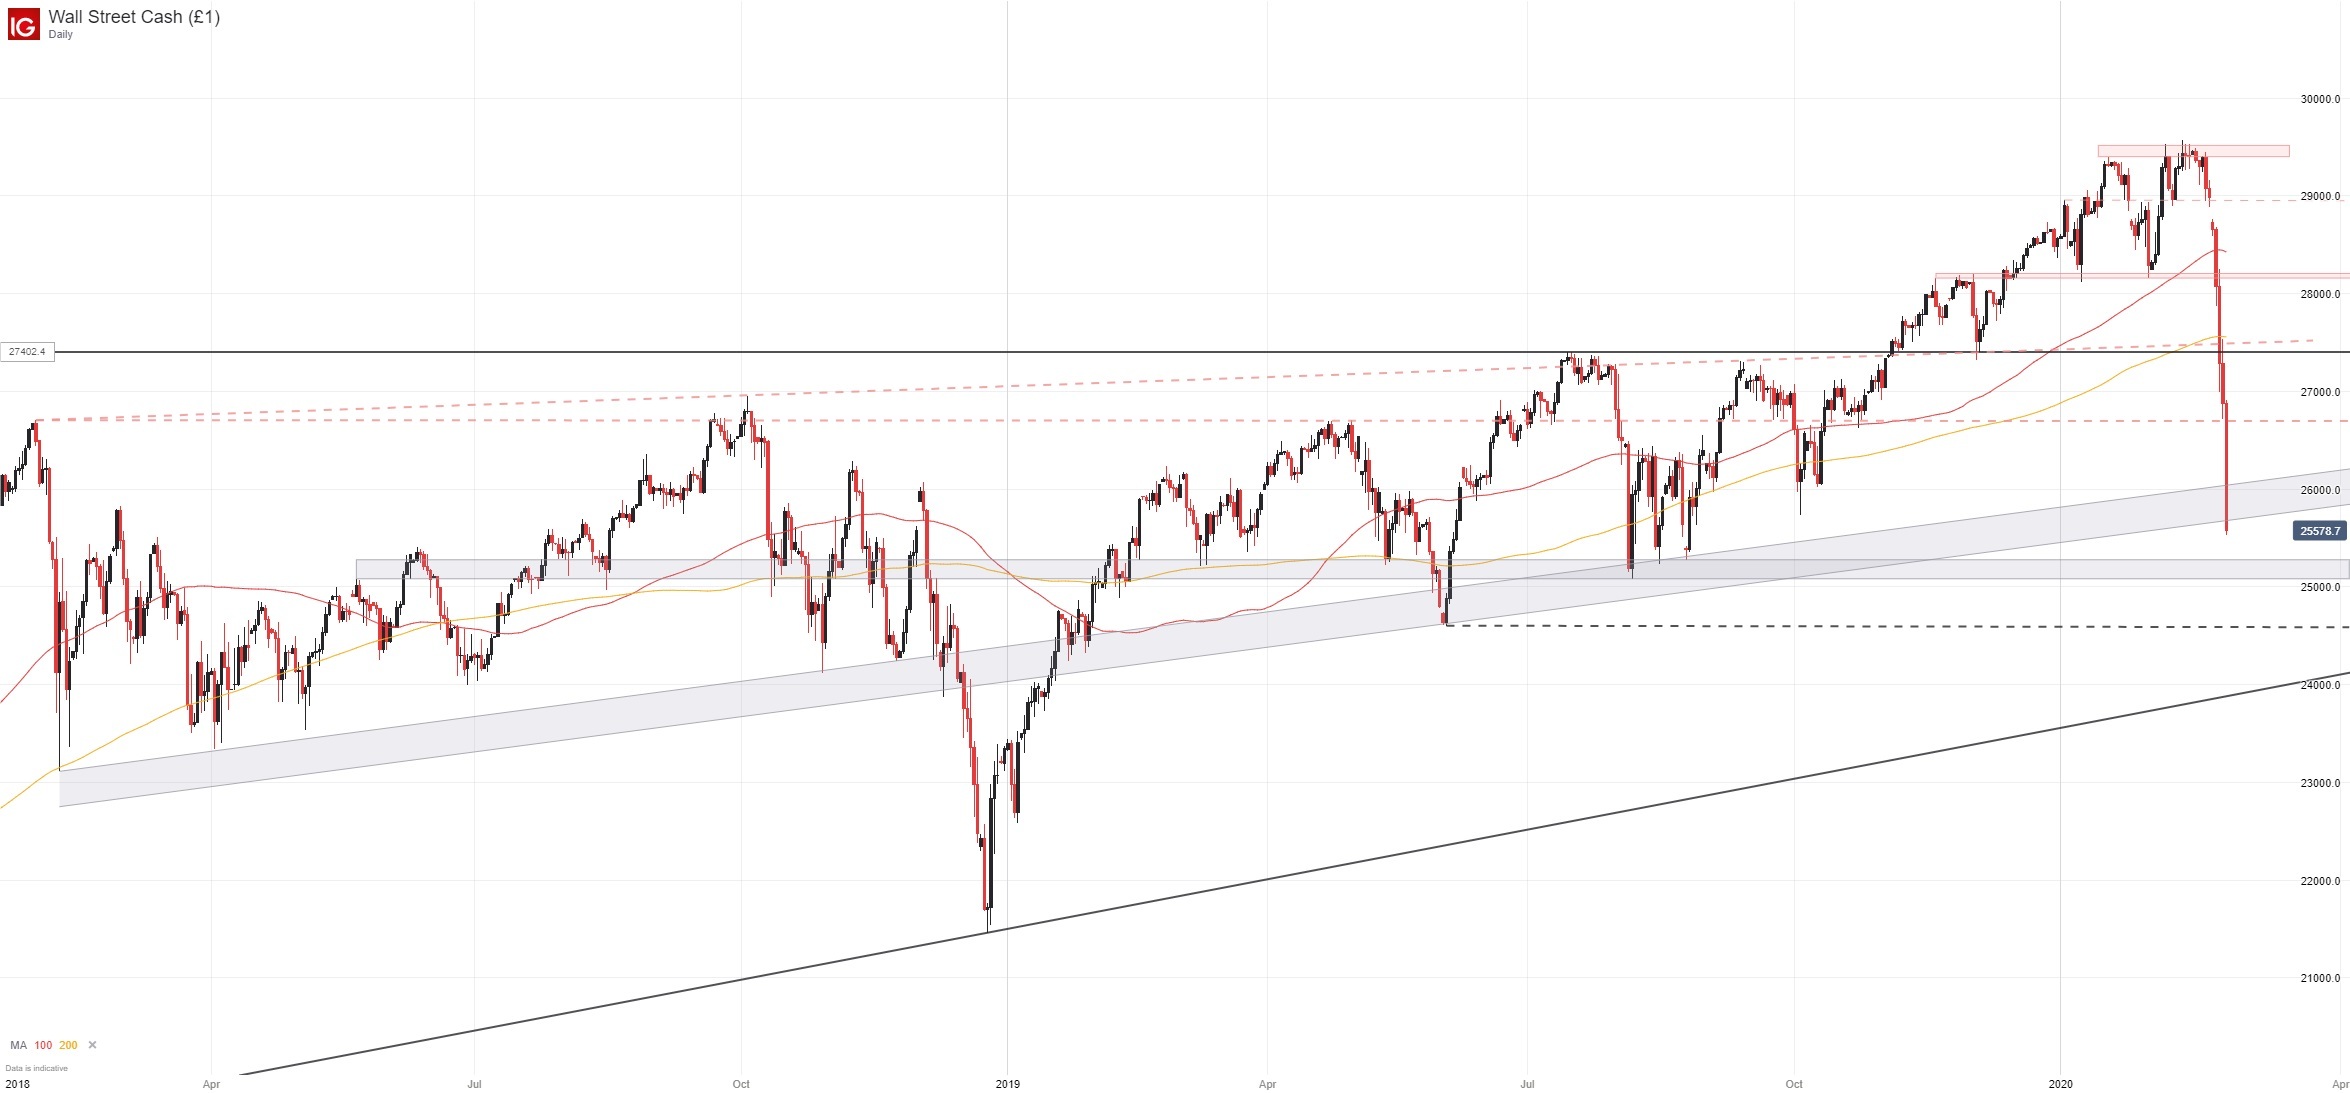
Not only did the move signify a critical breach of support, it may also weigh on recovery attempts in the days ahead as support turns to resistance. Either way, the technical picture for the Dow Jones has become dire and many chartists may be left grasping for relevant levels.
That said, two zones of possible support reside nearby. First at the 25,290 to 25,100 area which has been the epicenter of indecision in the past, most recently August 2019, and second around 24,590 which originates from the index’s June low.
With that in mind, a broader timeframe may be required to grasp the scale of the current rout. With losses diving through formidable support levels at break-neck speeds - and fundamental uncertainty running rampant – longer-term levels may become useful.
Dow Jones Price Chart: Weekly Time Frame (January 2009 – February 2020)
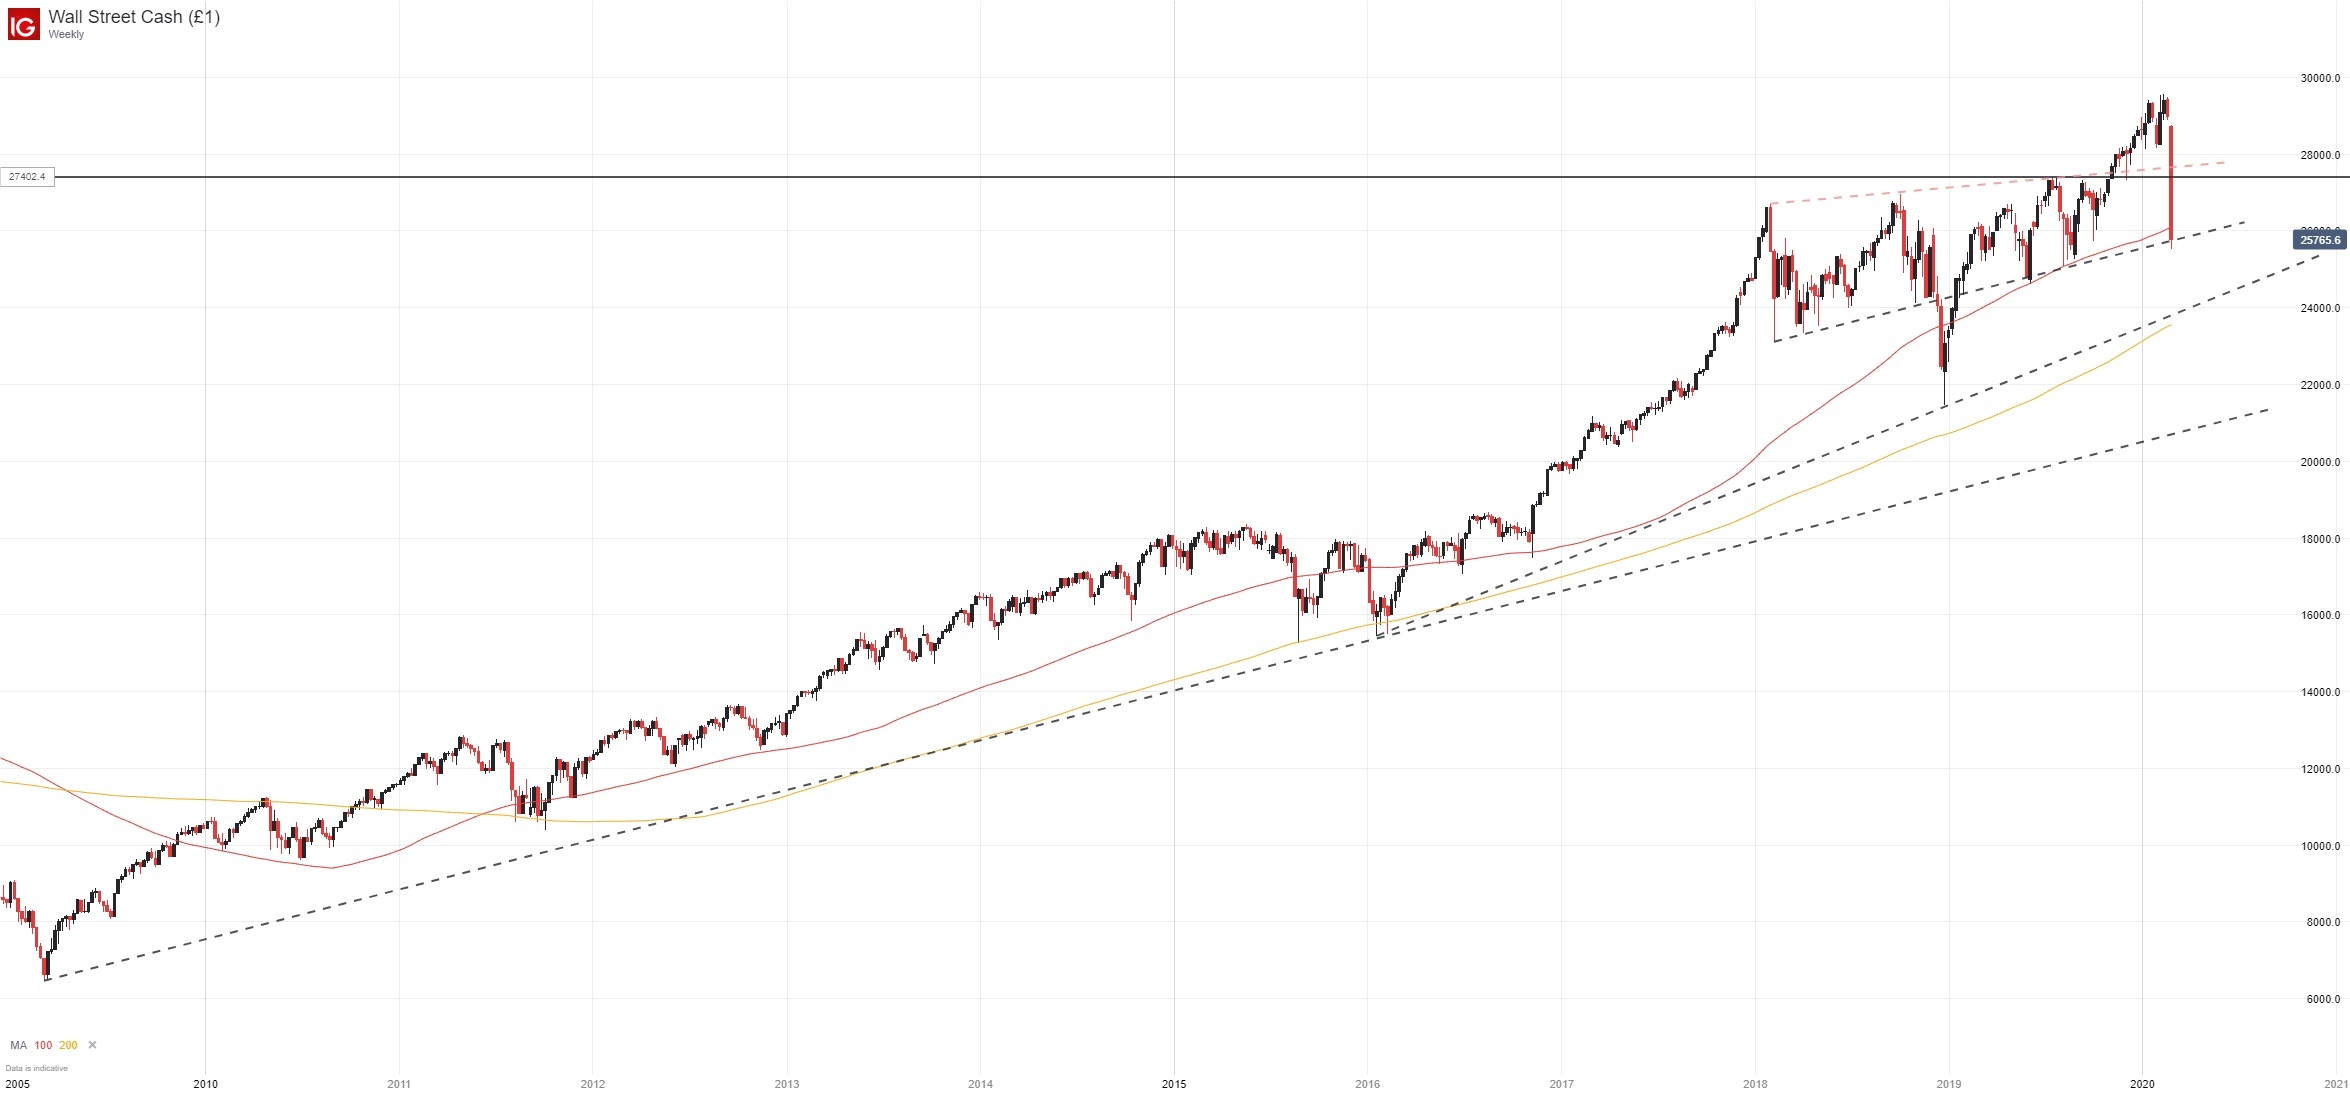
To that end, a prospective trendline drawn off the lows in 2016 and 2018 may look to provide assistance around 24,000. Secondarily, a rising trendline from 2009 may come into play around 21,250, but technical levels on the Dow will likely be of little concern should prices fall that far. Still, it bears mention.
As stocks grasp for a bottom, traders can look to other markets for insight. Encouragingly, gold has slowed its ascent in recent days, possibly suggesting the demand for safety is slowing. Further still, the growth-sensitive Australian Dollar has momentarily stalled its decline following a bearish break lower last week. Together, the two markets show signs of life, but concerns linger.
Crude oil continued lower alongside stocks on Thursday, extending its decline well beyond the longstanding technical level around $50. The growth-linked commodity is often viewed as an economic bellwether and its meteoric fall over the last few days is surpassed only by equity markets.
Crude oil and copper – another growth-linked commodity – had suffered weeks ago with the former comfortably within a bear market. Given their decline prior to that of the Dow Jones, Nasdaq and S&P 500, the current price action in stocks may just be a delayed response to the coronavirus, a possibility I noted in January.
Regardless, the fundamental forces at play are extremely difficult to forecast given the lack of precedent. Thus, market volatility may continue in the days ahead as investors attempt to identify the appropriate valuation of the assets affected. In the meantime, follow @PeterHanksFX on Twitter for updates and analysis on the stock market.
--Written by Peter Hanks, Junior Analyst for DailyFX.com
Contact and follow Peter on Twitter @PeterHanksFX


