


Dow Jones, S&P 500 Forecast:
- The Dow Jones approaches the famed 30,000 mark as bullishness continues
- Similarly, the S&P 500 nears 3,400
- While the fundamental landscape may be uninspiring, price action suggests bulls possess control
Dow Jones, S&P 500 Price Outlook: Prior Records to Act as Support
Stocks continued their climb on Wednesday even as gold broke higher and the Australian Dollar remained pressured – a theme I outlined yesterday. While some market participants have sought safety and to reduce risk exposure, it seems as though many are confident the rally can continue higher as evidenced by new records for both the Nasdaq 100 and S&P 500 with the Dow Jones trailing closely behind. Regardless of the fundamental foundation, it appears traders and confident in a continuation higher for equities and technical traders will rejoice as prior resistance turns to support.
Dow Jones Technical Forecast
To that end, the Dow Jones will look to a nearby trendline that coincides with various swing lows dating back to October before the peaks in November and early December will come into play around 28,150. Interestingly, the Dow is threatening to form a trading range between 29,500 and 28,150 since it has displayed difficulty in surmounting nearby resistance.
Dow Jones Price Chart
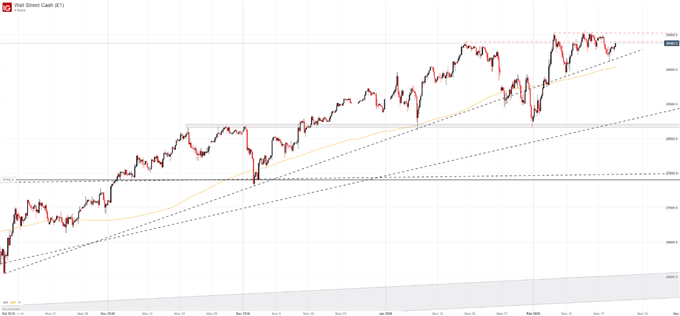
Should risk aversion reemerge and support hold, the DJIA could confirm the potential boundaries and enjoy much-needed consolidation. In the meantime, bulls may continue to probe the 29,395 and 29,500 levels.

S&P 500 Technical Forecast
In the case of the S&P 500, bulls have been able to establish a higher-high from last week and may have their sights set at the 3,400 level. Should the ascent continue, technical traders will seek assistance around the 3,350 and 3,337 levels in the event of a modest pullback. Like the Dow Jones, subsequent support may be offered at what seems to be the lower bound of a prospective range for the index – around 3,200 for the S&P 500.
S&P 500 Price Chart
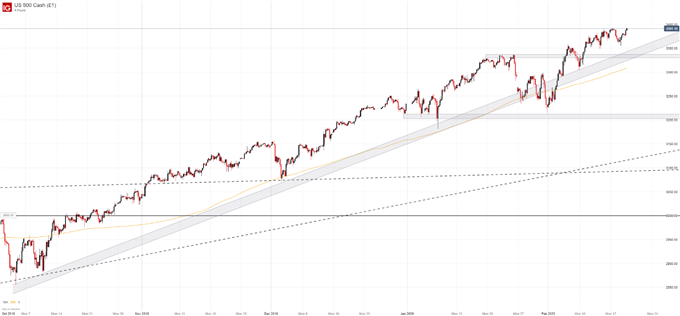
Again, the index would have to slip beneath nearby support and remain between 3,337 and 3,200 for some time to establish such a range, but the makings of such a formation are certainly present. Moving forward, however, risk appetite appears persistent and retail clients are overwhelmingly bearish on US equities – a possible sign they could continue higher. With that in mind, I would argue proper risk management and close monitoring of positions is critical with the current trading landscape.
--Written by Peter Hanks, Junior Analyst for DailyFX.com
Contact and follow Peter on Twitter @PeterHanksFX


