


Charts for Next Week:
- EUR/USD running lower into big long-term support
- USD/JPY stuck hanging around 2015 trend-line
- US Dollar Index (DXY) heading towards 2019 high
EUR/USD has been getting crushed, with it posting some of its cleanest momentum in some time. The downdraft is so much powerful as persistent. FX volatility remains very low, so the move lower has been relatively orderly.
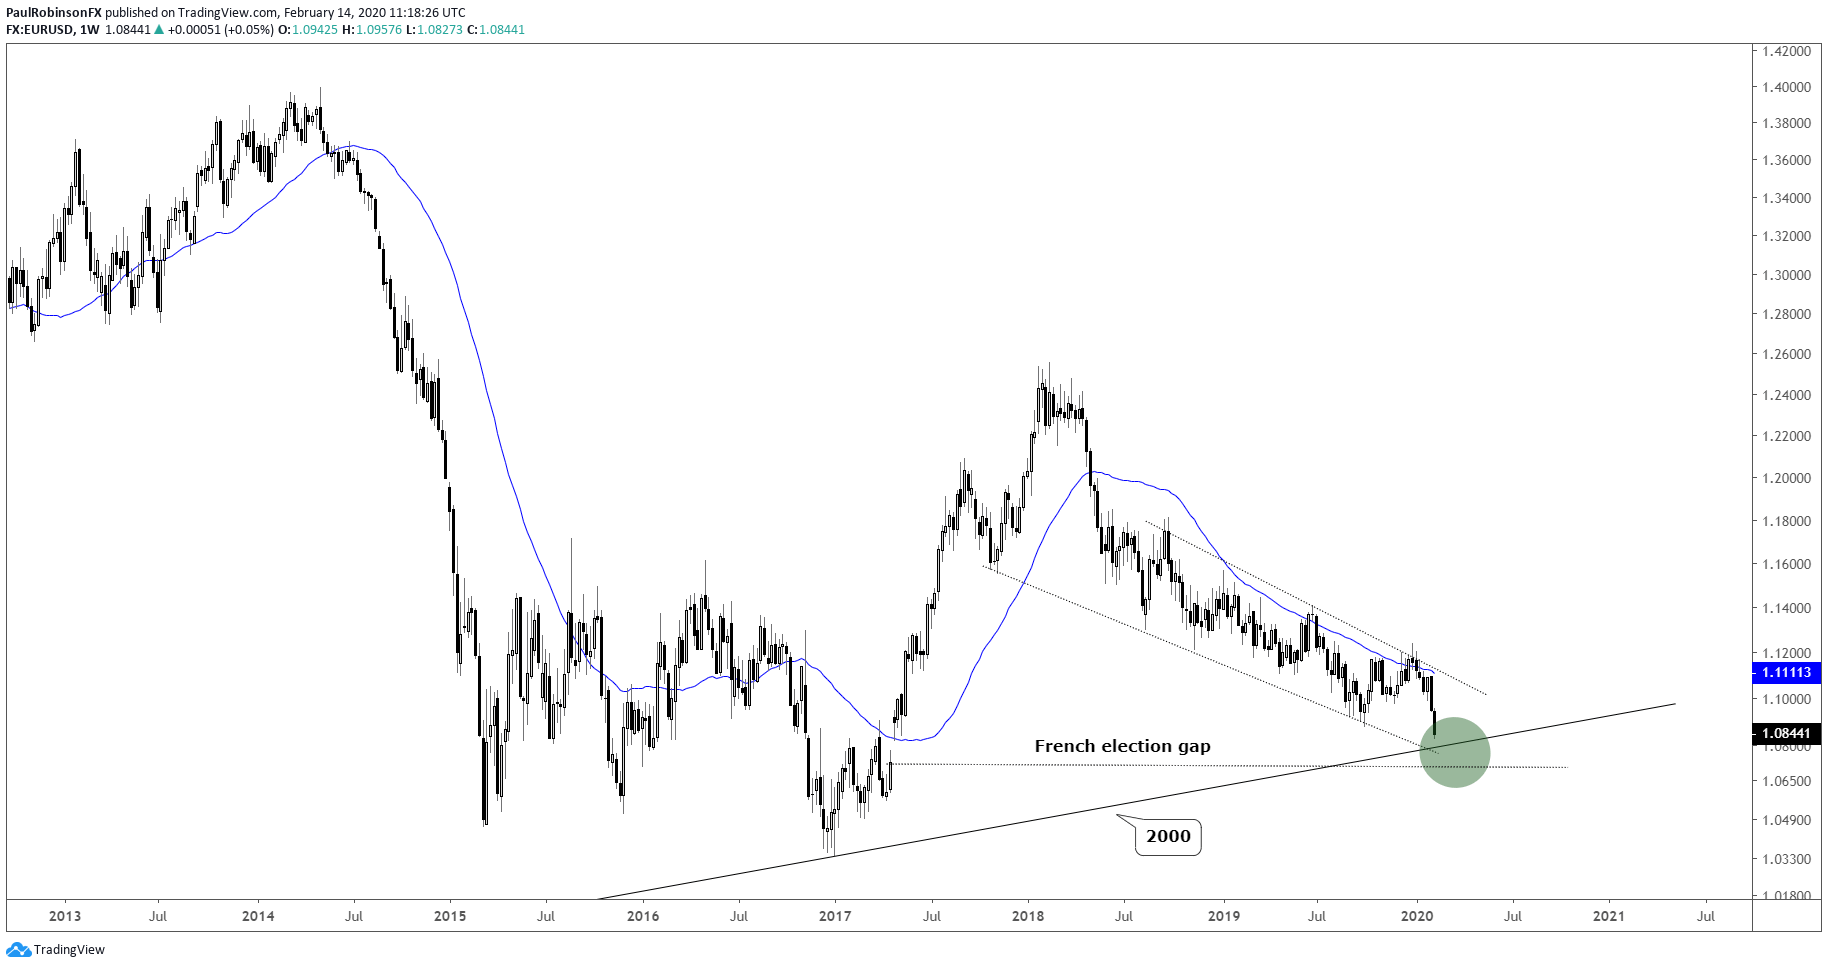
With that said, things could get volatile soon with some big long-term levels coming up. The French election gap from 2017 is being tested, with a full fill nearing at 10724. There also lies in the vicinity, depending on how you draw it and whether you use a log scale or not, a trend-line running up from 2000. We have to give some latitude given the duration, but it is hanging out in the vicinity. A big reaction could come soon.

EUR/USD Weekly Chart (2000 trend-line, French election gap)
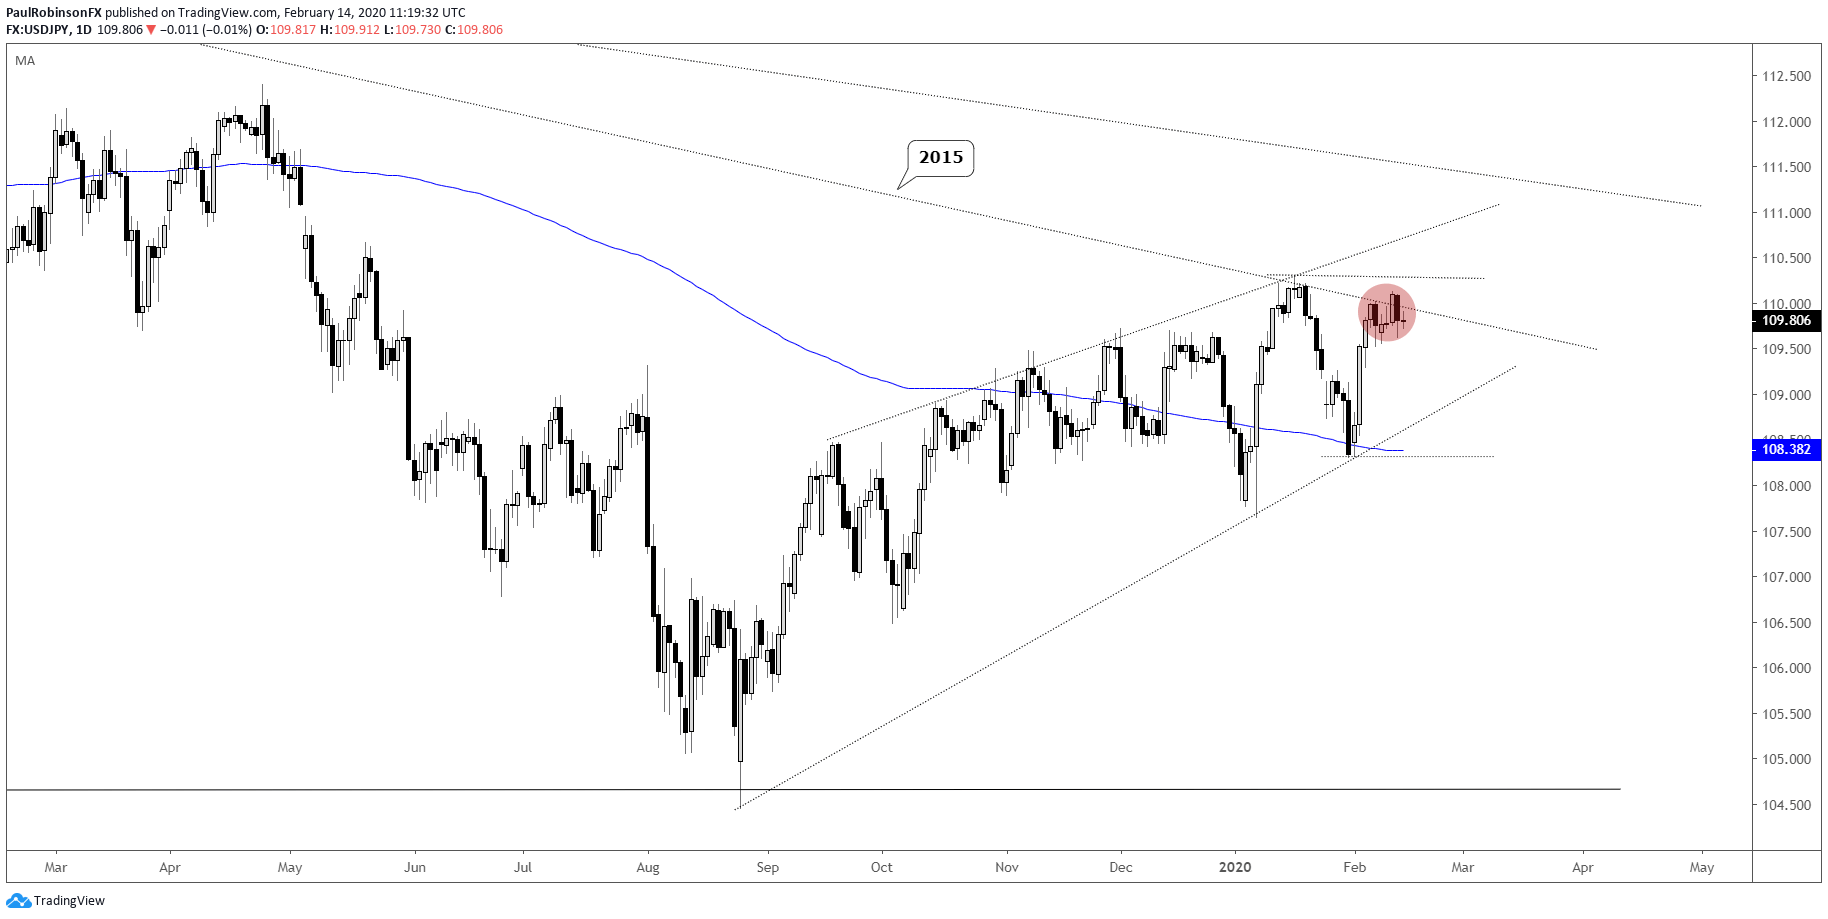
USD/JPY has been stuck in a tight range for over a week, highlighting the historically low levels of FX volatility we are seeing these days. There is a solid trend-line from 2015 helping keep a lid on a further advance off the end of January low. A break above 11029 is needed to shake it loose on the upside., otherwise another turn down could be coming and further congest the already congested price action.
USD/JPY Daily Chart (congested around 2015 trend-line)
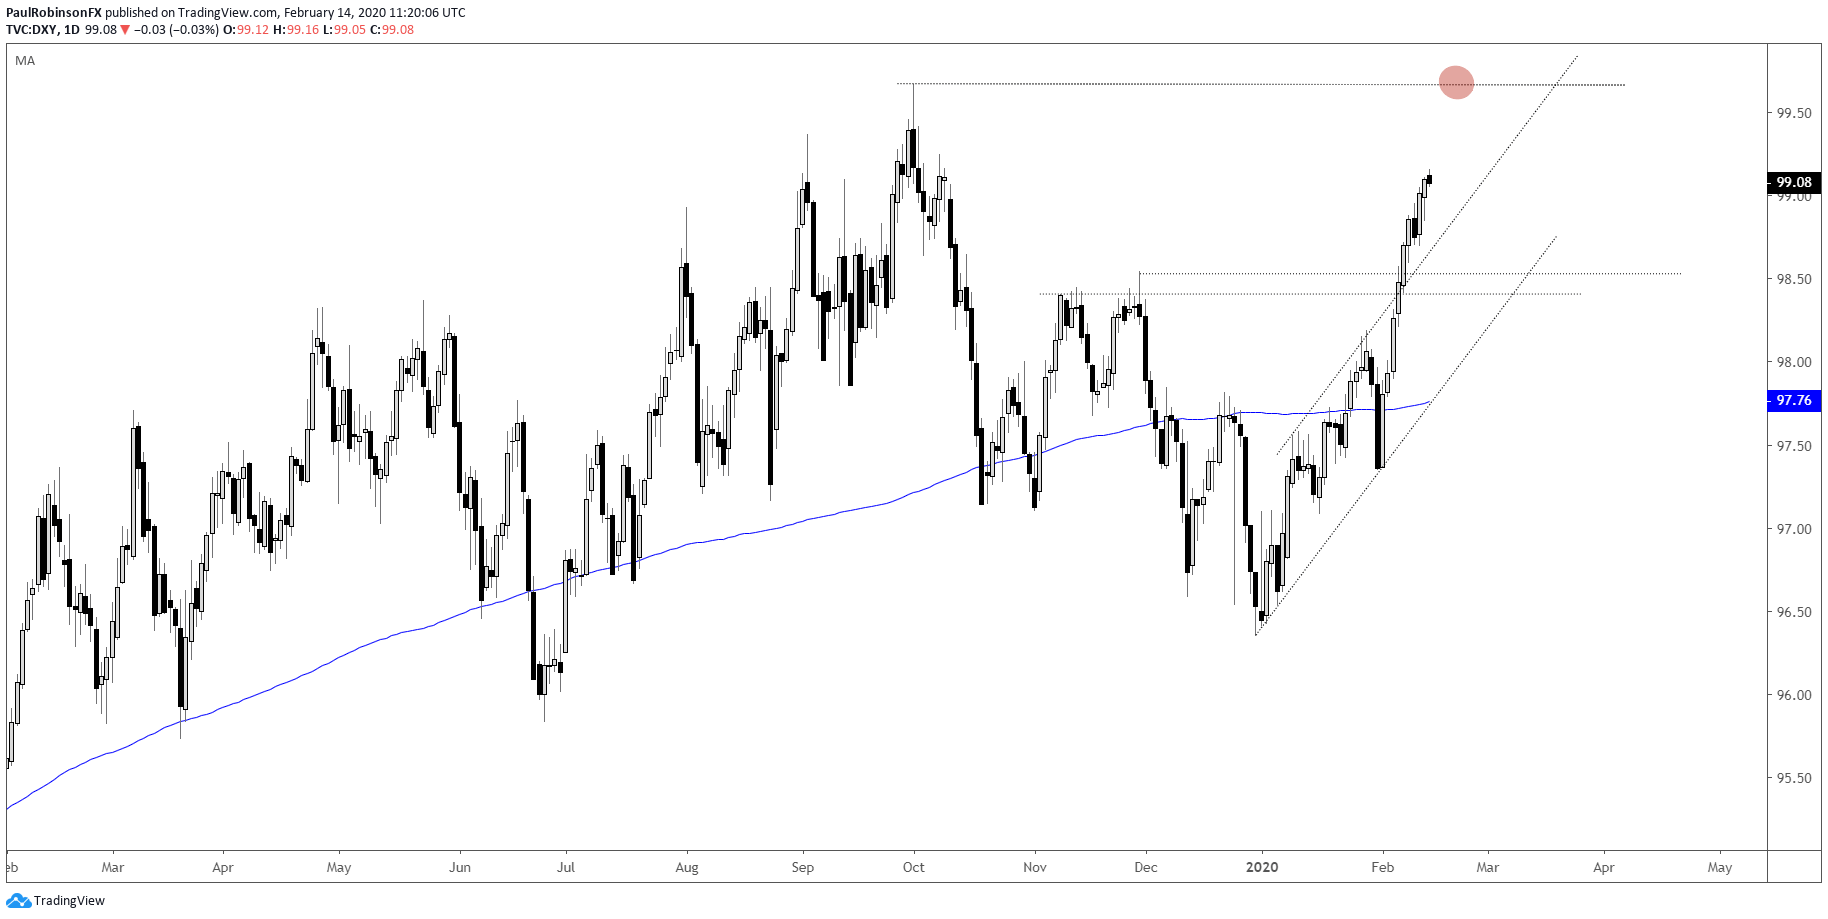
US Dollar Index (DXY) continues to rise on the heavily weighted Euro’s decline. The move is a bit extended, and we may see a bit of backing and filling as the Euro approaches a big level, but overall the expectation is for the 2019 high at 99.67 to be met or exceeded soon.

US Dollar Index (DXY) Daily Chart (reaching for 2019 highs)
U.S. Dollar Currency Index (DXY) Chart by TradingView
For all the charts we looked at, check out the video above…
Resources for Index & Commodity Traders
Whether you are a new or an experienced trader, DailyFX has several resources available to help you; indicator for tracking trader sentiment, quarterly trading forecasts, analytical and educational webinars held daily, and trading guides to help you improve trading performance.
We also have a series of guides for those looking to trade specific markets, such as the S&P 500, Dow, DAX, gold, silver, crude oil, and copper.
---Written by Paul Robinson, Market Analyst
You can follow Paul on Twitter at @PaulRobinsonFX


