


Ripple (XRPUSD) Price, News and Analysis:
- Ripple looking to break a series of lower highs.
- 200-day moving average now adding support.
Introduction to Bitcoin – Essential Knowledge for Bitcoin Traders
Ripple (XRP) Chart Turning Positive After Recent Rally
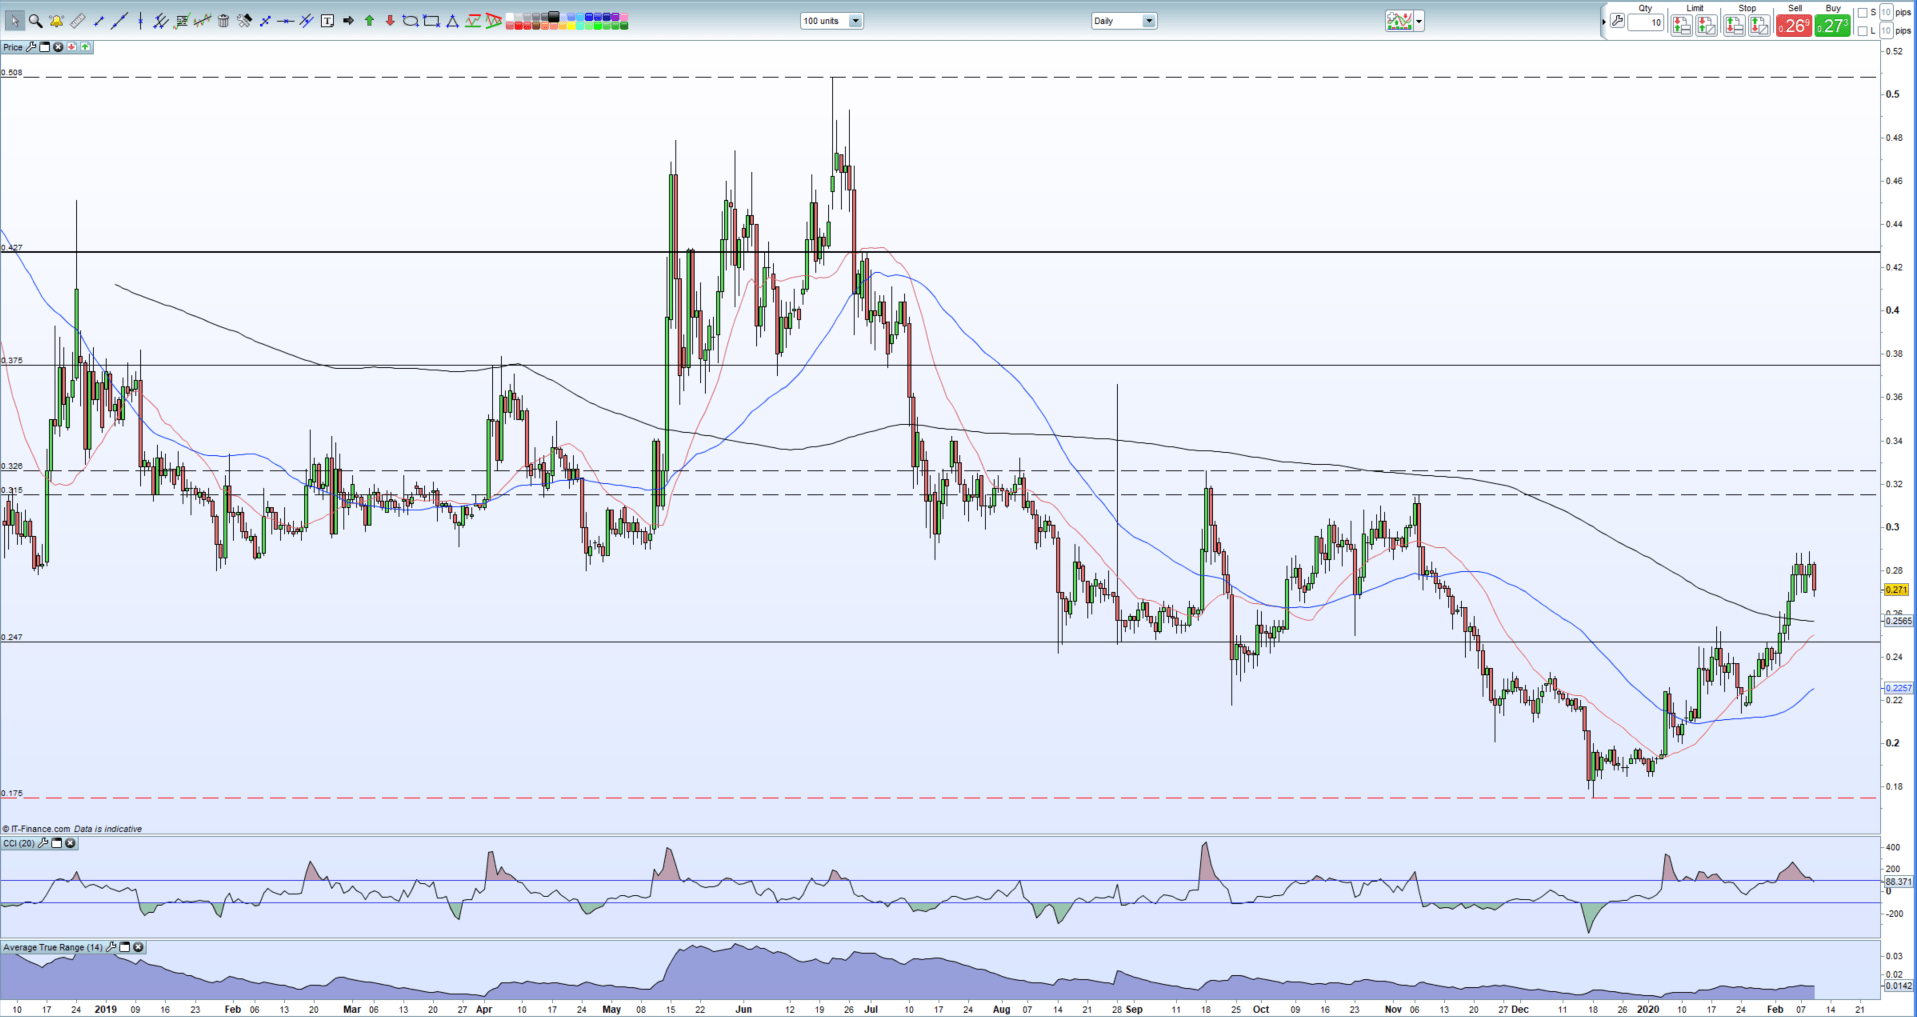
The technical set-up for Ripple continues to look more positive with the daily chart showing a few positives for the short- to medium-term. Looking at the moving averages, Ripple is now using the 20-day ma as support since early January this year, while last Tuesday’s decisive break and close the 200-day ma added extra credence to the recent rally. Ripple has no traded above the long-term moving average since mid-July 2019 and suggests that positive momentum continues to flow towards the coin. A series of short-term higher lows and higher highs off the mid-December low is another positive sign.
If Ripple is to re-test the mid-June high at $0.508, it needs to break and close above the November 19 high at $0.315 to invalidate the medium-term series of lower highs that started in mid-June. A break and close above $0.326 would confirm this move. Support is seen between $0.2475 and $0.2565 and a clear break below these levels would make the short-term outlook cloudy. Ripple has just moved out of overbought territory.

Ripple (XRPUSD) Daily Price Chart (December 2018 – February 10, 2020)

Traders may be interested in two of our trading guides – Traits of Successful Traders and Top Trading Lessons – while technical analysts are likely to be interested in our latest Elliott Wave Guide.
What is your view on Ripple (XRPUSD) – bullish or bearish?? You can let us know via the form at the end of this piece or you can contact the author via Twitter @nickcawley1.


