


Charts in Focus:
- US Dollar Index looking for new cycle highs
- AUD/USD could be at 2009 levels again soon
- GBP/USD broke support, watch 200-day
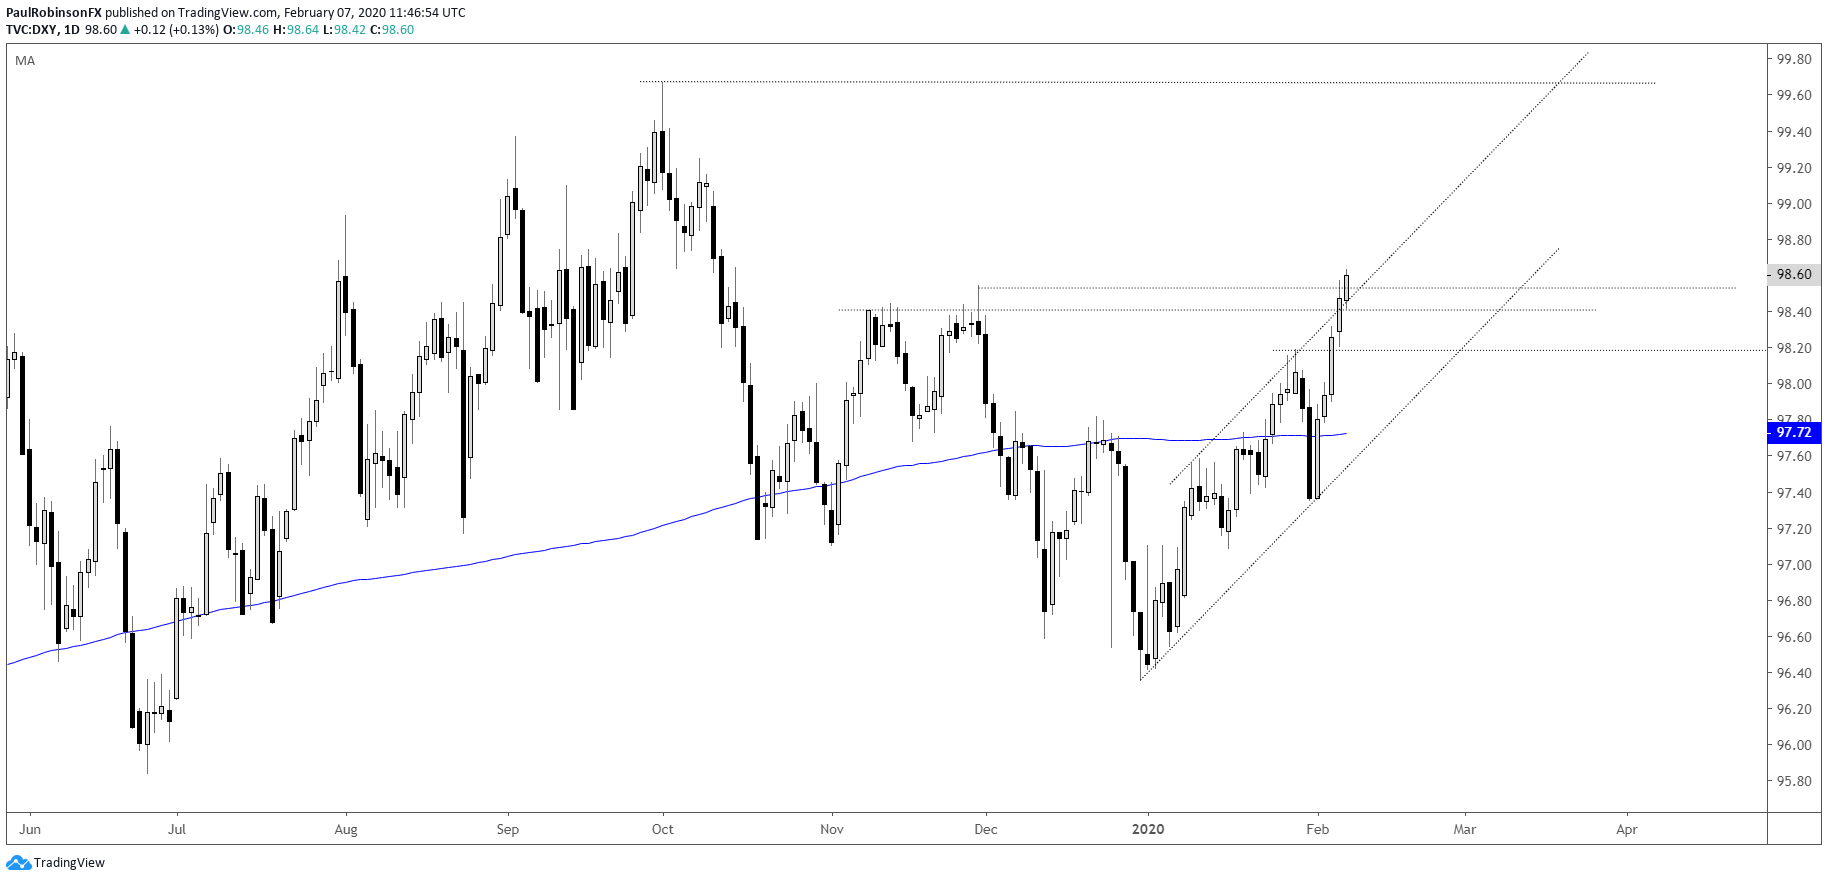
US Dollar Index (DXY) strength is continuing this morning for a 5th straight day, we’ll have to see if it can maintain or even further along following the release of NFPs. A close above 98.54 puts the index in open space to trade towards the October 1 high at 99.67 and the 100-line. There will likely be some bumps along the way as volatility remains low and keeps price action choppy, but the general trading bias is for more USD strength.
US Dollar Index (DXY) Daily Chart (trekking higher)
AUD/USDis extremely close to trading at new cycle lows below the 6670-mark from October. This is a big area around here with several powerful lows since August, thus making a break potentially important because at that point it will be trading at levels Aussie hasn’t seen since 2009. A bit of a hold and then break may make for a congestion pattern for traders to use as a set-up. Given the general trend and tone longs hold little appeal from where I sit.
AUD/USD Daily Chart (probing big support)

GBP/USDbroke important support yesterday via the 12940/3000-area. The break gave it clearance below a trend-line from November and good short-term horizontal support. After the upside fake-out into Jan 31 and downside breakdown now developing, looking for selling to come in and take Cable to around the 200-day MA.
GBP/USD Daily Chart (below support)

For all the charts we looked at, check out the video above…
Resources for Index & Commodity Traders
Whether you are a new or an experienced trader, DailyFX has several resources available to help you; indicator for tracking trader sentiment, quarterly trading forecasts, analytical and educational webinars held daily, and trading guides to help you improve trading performance.
We also have a series of guides for those looking to trade specific markets, such as the S&P 500, Dow, DAX, gold, silver, crude oil, and copper.
---Written by Paul Robinson, Market Analyst
You can follow Paul on Twitter at @PaulRobinsonFX


