


Dow Jones, Nasdaq 100, S&P 500 Price Outlook:
- The Dow Jones tagged a fresh record on Thursday before retreating modestly early Friday
- On the back of Tesla’s meteoric rise, the Nasdaq 100 also established new highs this week
- Meanwhile, the S&P 500 will look to hold above horizontal resistance around 3,340
Dow Jones Technical Forecast
The Dow Jones probed record levels on Thursday as bullish appetite persisted ahead of Friday’s Non-Farm Payrolls report. After a flurry of volatile trading sessions, investors have seemingly discarded coronavirus concerns as they exchange pessimism for optimism and push stocks to new heights. With strong employment data, bullishness would be within reason if not for the substantial gains established earlier this week. Now, the Dow Jones will have to establish a daily close above prior highs before it can look to climb further.
Dow Jones Price Chart: 4 – Hour Time Frame (October 2019 – February 2020)

Difference between Dow, Nasdaq, and S&P 500: Major Facts & Opportunities
To that end, it appears bulls are making a concerted effort to post such a performance as they linger near all-time highs. If a daily close above 29,400 is cemented it would offer encouragement in pursuit of a continuation higher next week. On the other hand, bears will look to keep the Industrial Average contained beneath the level which would leave the index more vulnerable to pull backs around the 29,000 and 28,170 areas.
Nasdaq 100 Technical Forecast
The Nasdaq has experienced a particularly volatile week as Tesla shares inflated and mania ensued. Nevertheless, the stock has helped boost the Nasdaq this week and has played a role in driving the tech-heavy index to new heights.
Nasdaq 100 Price Chart: 4 – Hour Time Frame (October 2019 – February 2020)

Nasdaq Trading Basics: How to Trade Nasdaq 100
Now, the index will look to hold above support around 9,270 as it attempts to press higher still. Resistance is unsurprisingly sparse apart from the record-setting 9,460 level which is narrowly above the Nasdaq’s trading price at the time of this article’s publication. Should bears reemerge and break the 9,270 level, subsequent support should reside at the ascending trendline established from the October lows.
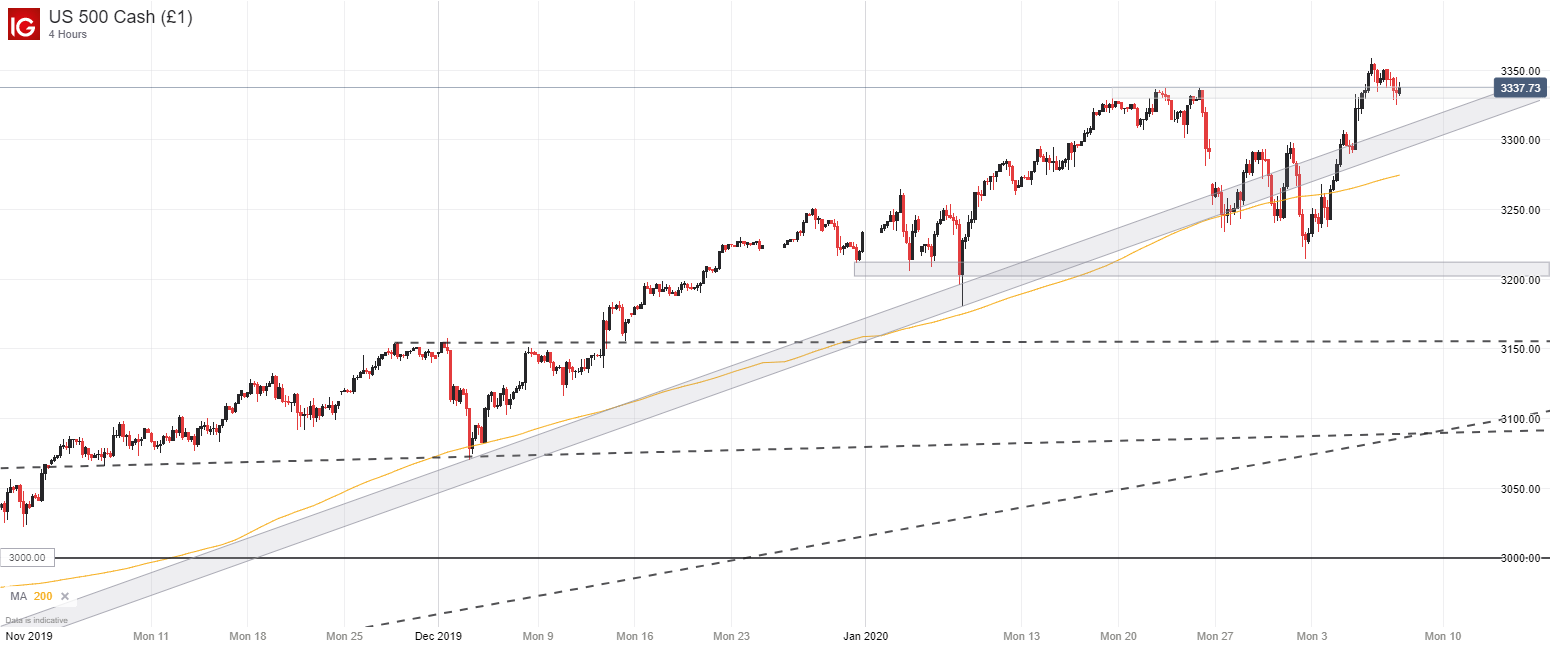
S&P 500 Technical Forecast
Meanwhile, the S&P 500 trades slightly above its recent trading range between 3,200 and 3,340 near all-time highs. While 3,340 may provide a modicum of indecision in the event of a pullback, its proximity to price reduces its efficacy. Consequently, subsequent support around 3,300 – which aligns with an ascending band from the index’s October lows – could lend assistance.
S&P 500 Price Chart: 4 – Hour Time Frame (October 2019 – February 2020)
How to Trade S&P 500 Index: Strategies, Tips & Trading Hours
To be sure, a larger retracement would likely require the support of horizontal resistance from 3,210 to 3,200 as it has displayed an ability to stall recent declines. With that in mind, the ascending band that transverses the range may serve as support on an intraday basis, but likely lacks the influence to halt a larger move given the current trading price.

Since coronavirus fears have retreated, the Dow Jones, Nasdaq 100 and S&P 500 will look to upcoming economic data for influence as investors look to extend the recent rally. Similarly, IG Client Sentiment data reveals retail traders are confident the recovery is overdone – an indication that price may continue upward.
| Change in | Longs | Shorts | OI |
| Daily | 1% | -4% | -2% |
| Weekly | 17% | -17% | -4% |
That being said, the viral outbreak appears far from resolved, so risk aversion could emerge at any time. For this reason, stops become all the more crucial as the theme has shown an ability to spark volatility. In the meantime, follow @PeterHanksFX on Twitter for updates and analysis.
--Written by Peter Hanks, Junior Analyst for DailyFX.com
Contact and follow Peter on Twitter @PeterHanksFX


