Crude Oil (CL/USD) Price, Analysis and Charts
- Global growth may struggle as Chinese coronavirus continues to spread.
- Crude oil rebounds off strong support but price action is limited.
Crude Oil Price Slumps Over 20% This Year
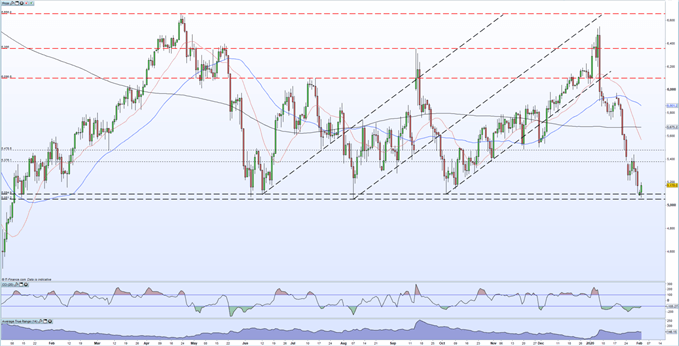
Crude oil has entered bear market territory after crashing 22% from the January 9 high of $65.46/bbl. to a low of $50.66/bbl. made in early trade today. The ongoing spread of the deadly Chinese coronavirus has prompted fears that Chinese, and global, growth will take a hit, crimping demand for oil. According to the BBC, there are more than 17,000 confirmed cases of the virus in China with 361 fatalities in the mainland. The World Health Organization (WHO) declared a global health emergency on January 30.
The daily chart shows that crude oil touched a noted support area in the last couple of trading days and this support needs to hold if crude oil is to stabilize and start to push higher. Three times in the last year, oil has rebounded off the $50.50/bbl. to $50.95/bbl. zone before pushing steadily higher and back above $60.00/bbl. All three-prior sell-offs show have been sharp and may suggest that the recent bear market slide will soon reverse. The CCI indicator shows the oversold nature of the market, while the ATR indicator shows the recent pick-up in volatility. Any rebound is likely to find resistance just below the $55.00/bbl. level. If oil makes a confirmed break lower, the December 2018 low at $42.44/bbl. stands out.


For a full rundown of all market moving economic data and events see the DailyFX Calendar
Crude Oil Daily Price Chart (January 2019 – February 3, 2020)


Traders may be interested in two of our trading guides – Traits of Successful Traders and Top Trading Lessons – while technical analysts are likely to be interested in our latest Elliott Wave Guide.
What is your view on Oil – bullish or bearish?? You can let us know via the form at the end of this piece or you can contact the author via Twitter @nickcawley1.


