


Bitcoin (BTC) Price Outlook:
- Bitcoin is up more than 20% in 2020 thus far, a testament to the asset’s volatility
- After slumping in the second half of 2019, Bitcoin pressured technical support at $7,000
- In the midst of a rebound, BTC/USD will have to surmount the 200-day simple moving average before it can continue higher
Bitcoin (BTC) Forecast
Bitcoin is 20% higher in the month of January as it looks to recreate the stellar performance it enjoyed in 2019. That being said, Bitcoin’s return in the second half of last year was less encouraging and it left the cryptocurrency grasping for support. Now, BTC/USD has rebounded to probe the 200-day simple moving average around $9,000. Will BTC continue higher or will the technical barrier mark the end of the rally?
Bitcoin (BTC) Price Chart: Daily Time Frame (April 2019 – January 2020) (Chart 1)
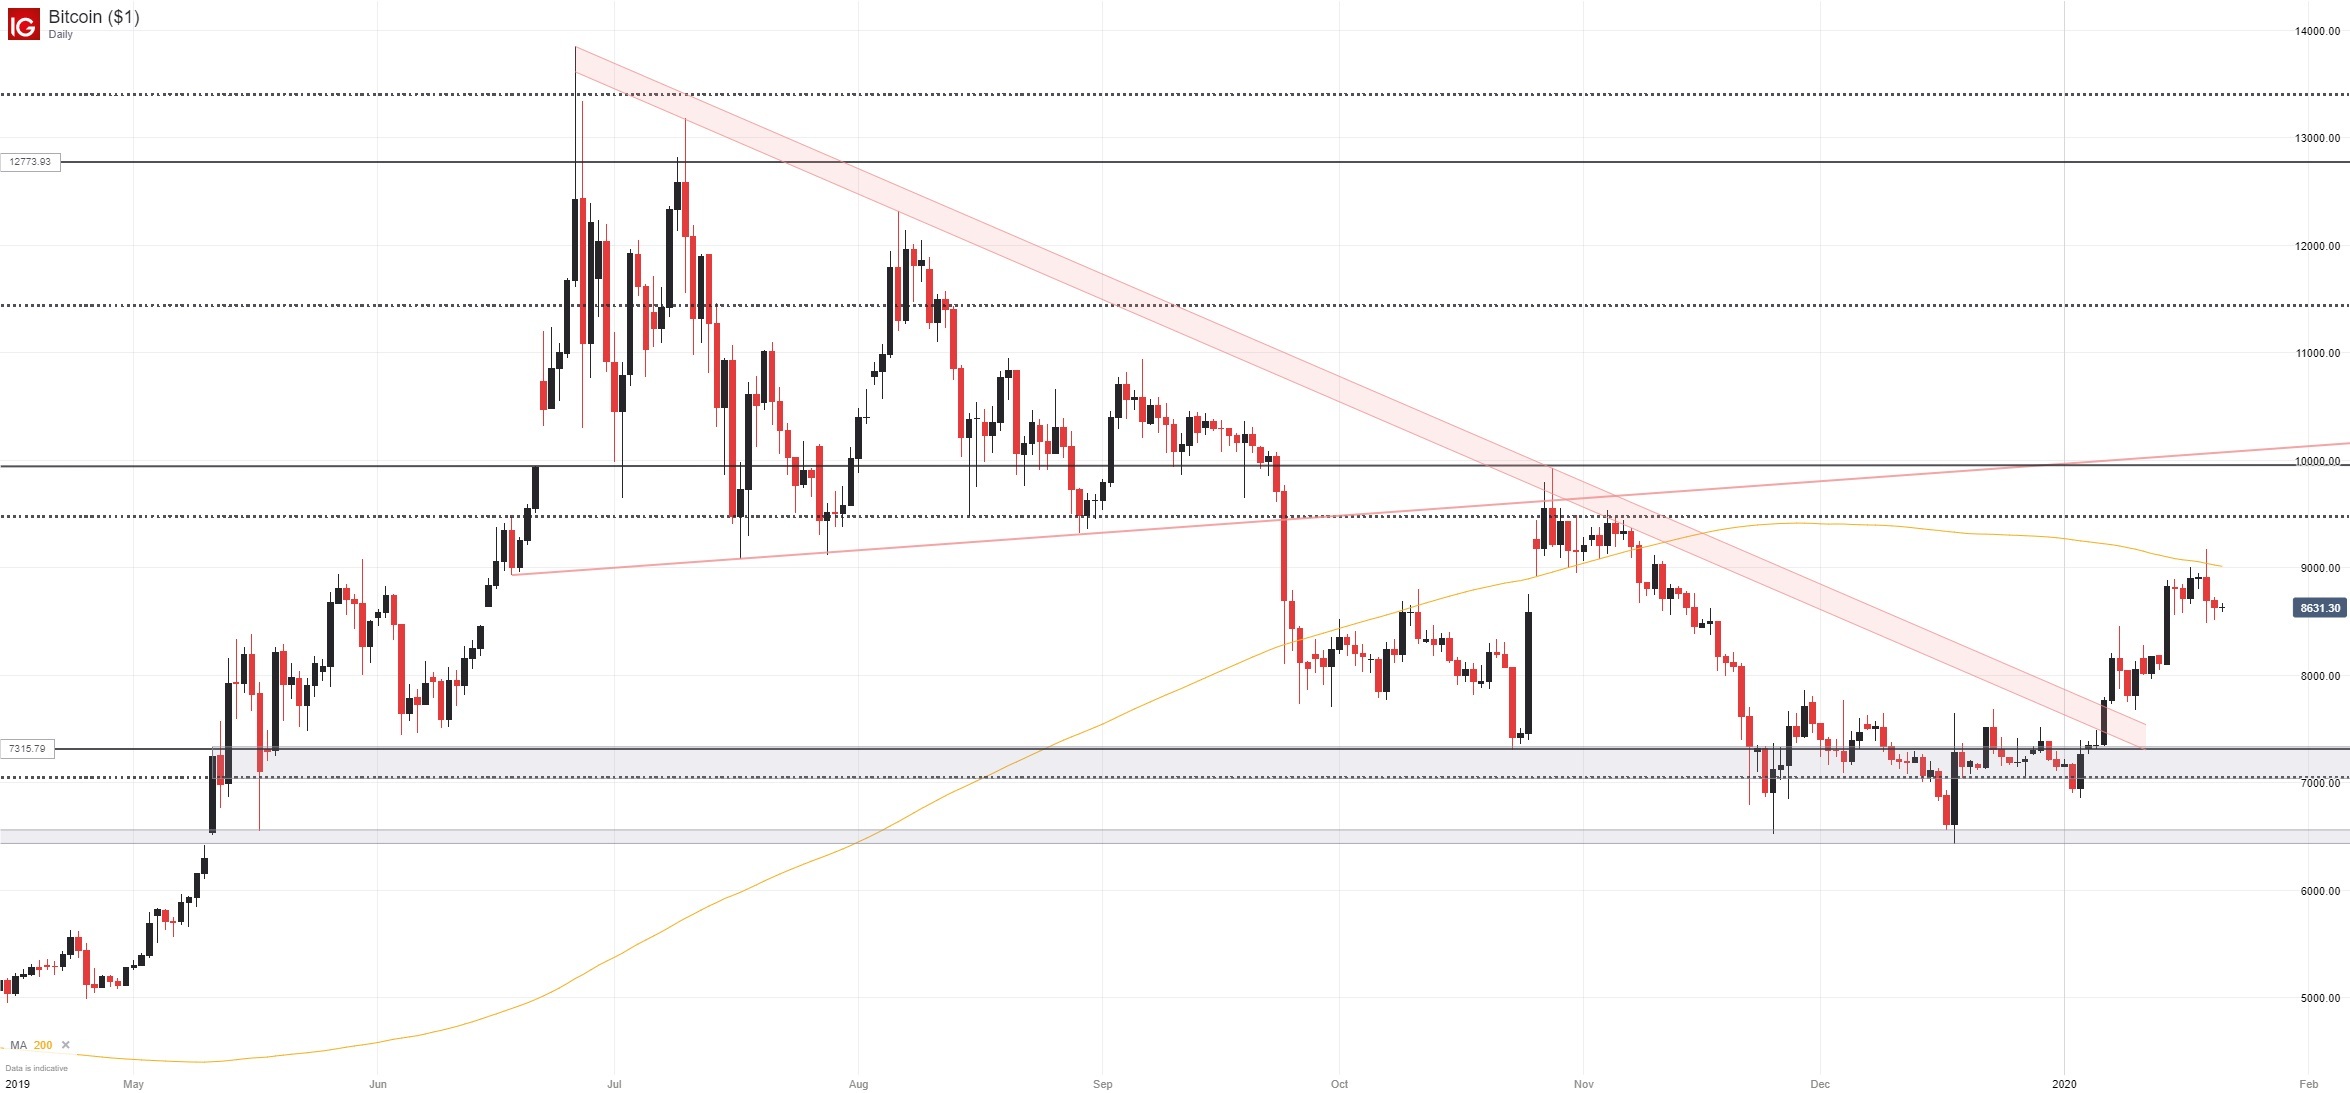
Bitcoin suffered a brief flash crash over the weekend, highlighting the uncertainty and volatility that can accompany bitcoin trading. Nevertheless, price remains within reach of the 200-day moving average around the $9,000 mark and bulls will look to press higher still. The technical level will offer robust resistance – as it has in the past – but a break above could open the door for further gains.

Should the level fail, secondary resistance will materialize around the $9,500 area where a Fibonacci level resides and at the psychologically significant $10,000 level. Together, the levels will look to keep BTC/USD contained. While bulls have undoubtedly shown interest, IG Client Sentiment reveals most retail traders are net-long which we typically view as a contrarian indicator.

To that end, should bears look to resume the downtrend that began in June, BTC will look to employ support at the $7,350 to $7,000 level before secondary support can provide buoyancy around $6,500. In the meantime, follow @PeterHanksFX on Twitter for updates and analysis as bulls look to drive higher.
--Written by Peter Hanks, Junior Analyst for DailyFX.com
Contact and follow Peter on Twitter @PeterHanksFX
Read more: How to Invest During a Recession: Investments & Strategy


